


Stock and Commodity Market 60-Year Cycle Bottom Scenerios
Commodities / Cycles Analysis Nov 06, 2013 - 10:03 AM GMTBy: Clif_Droke

 With less than a year to go before the bottom of the 60-year Super Cycle many investors are wondering how the coming months will play out. There are at least two major possibilities that need to be discussed: the soft landing and the hard landing.
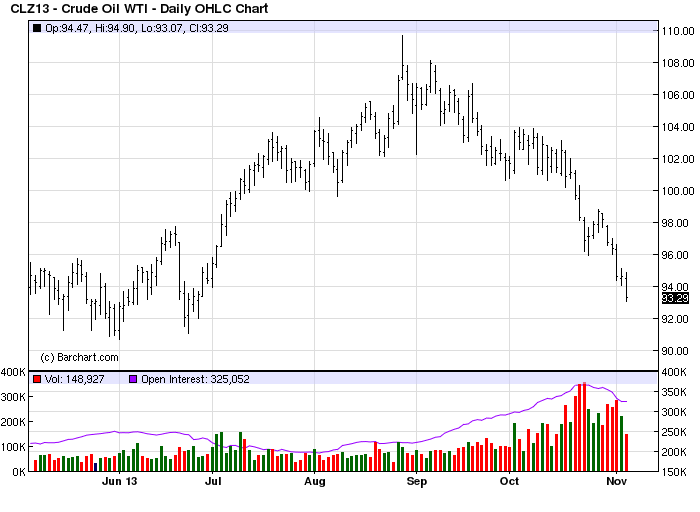
The effects long-term 60-year cycle, which answers to the economic long wave (K-Wave) can be seen in the fact that commodity prices and inflation are unusually low given the extraordinarily high levels of central bank and government stimulus in recent years. Despite $85 billion in monthly asset purchases by the Federal Reserve alone, the oil price - one of the most sensitive inflation indicators - has actually been declining in the last couple of months.
Its effects can also be seen in the fact that the job market remains an issue for central banks. The labor participation rate has dropped steadily in recent years as many unemployed have given up seeking work. And as we looked at in my previous commentary, money velocity has been steadily declining despite record amounts of liquidity being created by the Fed. All these indicators are symptomatic of a major deflationary undercurrent. The Fed is well aware of this structural problem and this is why it has steadfastly maintained a continuous flow of liquidity, for without this life-giving stimulus deflation would surely have its way altogether.
The long-term deflationary cycle has both a malevolent and a benevolent aspect. The negative attributes of this cycle are well chronicled and have been witnessed in recent years. The most obvious manifestation of this deflationary cycle was seen in the throes of the credit crisis of 2007-2009. The painfully slow nature of the job market recovery since then is a lingering reminder that deflation's work is not yet done.
Yet deflation can also be quite beneficial for consumers if allowed to take its course. In Japan deflation was a huge benefit to the country's aging population for some 20 years as low consumer prices helped the elderly and underemployed get by during times when the economy was sluggish. With the advent of Abenomics, Japan is finally starting to see signs of inflation after more than 20 years of falling prices. Just as Japan was the first major nation to feel the effects of the long-term deflationary cycle, it's also first to emerge from the long-wave deflationary winter. What is now happening to Japan is instructive, for it will also happen to the U.S. once the cycle has bottomed next year.
Stock prices have greatly benefited from the Fed's asset purchases and low interest rate policy. They've also benefited from the low commodity prices of the last couple of years, as can be seen in the CRB commodity index shown below, since profit margins are higher when input costs are lower. There's a possibility the stock market can dodge the proverbial bullet next year as the long-term cycle makes its final descent, thereby resulting in a mild bottom. If this happens, however, the danger to the economy will be acute in the years immediately following 2014.
By refusing to let prices fall continuously since 2008, the Fed's intervention has artificially boosted retail prices to an extent that the next inflationary long-term cycle that begins in late 2014/early 2015 could easily create runaway inflation. That is, prices and interest rates could go through the roof once the new cycle kicks into high gear. This is where Japan's experience will be most instructive.
Another thing to watch for as we enter the final months of the cycle is China. Note that China's stock market, as reflected in the Shanghai Composite Index (below), has been in a downward trend since 2009. China's economy has also been showing signs of weakness at various times in the past two years. A truism of the 60-year cycle is that the bottom must manifest somewhere. If it doesn't produce severe effects in the U.S. next year, it will surely do significant damage to another area of the globe. The most likely candidate is China.
With China's government significantly curtailing real estate growth over the past year, the risk of an economic crisis will increase with the added pressures of the deflationary cycle bottom in 2014. China is another problem area to watch as we enter the final months of the cycle.
By Clif Droke
www.clifdroke.com
Clif Droke is the editor of the daily Gold & Silver Stock Report. Published daily since 2002, the report provides forecasts and analysis of the leading gold, silver, uranium and energy stocks from a short-term technical standpoint. He is also the author of numerous books, including 'How to Read Chart Patterns for Greater Profits.' For more information visit www.clifdroke.com
Clif Droke Archive |
© 2005-2022 http://www.MarketOracle.co.uk - The Market Oracle is a FREE Daily Financial Markets Analysis & Forecasting online publication.