


Crude Oil and Its Connection with the U.S. Dollar
Commodities / Crude Oil Oct 22, 2013 - 04:33 PM GMTBy: Nadia_Simmons

 The recent months have been tough for the U.S. currency. Since July the greenback has lost 6% and dropped to a new eight-month low on Friday. Investors avoided the dollar, firstly after the Fed opted against cutting its stimulus in September and then as the budget spat in Washington pushed the country close to a default. Despite this decline, yesterday, the dollar pulled back from an eight-month low as investors awaited delayed U.S. jobs data.
Many investors think that the Fed will delay trimming its $85 billion-a-month bond-buying program until the economic impact of this month's partial U.S. government shutdown becomes clearer. The Fed's taper decision will ultimately be tied to the economic data. Therefore, this week all eyes will be on the crucial nonfarm payrolls report. The report was originally scheduled for release on Oct. 4, but because of the government shutdown, it will be released today. Analysts polled by Reuters expect payrolls to have increased by 180,000 in September, with the jobless rate steady at 7.3 percent. Therefore, a reading anywhere in the 160,000 to 190,000 range would probably be fairly neutral with respect to near-term U.S. dollar direction. Any signs of weakness may reinforce expectations that the Fed would hold off from scaling back its stimulus this year, pressuring the greenback. However, if it is a strong number it would suggest that the shutdown may have had only a limited impact and any strength in the jobs data could be used as an excuse to buy the dollar.
Taking the above into account, investors are probably wondering whether this report can have a positive impact on the greenback or not. When we take a look at the chart, we see that the dollar dropped to its new eight-month low in the previous week. What's interesting, at almost the same time we saw a new October low in crude oil.
This relationship between the U.S. dollar and light crude has encouraged us to examine their connection in the short term. However, before we focus on this issue, let's take a look at the long- and the medium-term crude oil chart to see if there's anything on the horizon that could drive the price of light crude higher or lower in the near future. Let's start with a look at the monthly chart of light crude (charts courtesy by http://stockcharts.com ).
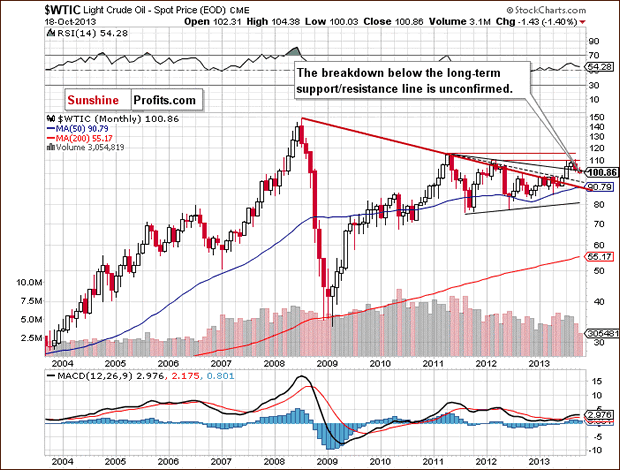
On the above chart we see that crude oil dropped below the long-term declining support/resistance line based on the September 2012 and March 2013 highs (the upper black line). However, the breakdown below this line is not confirmed at the moment. Please note that despite this downward move, crude oil still remains above the long-term declining resistance line based on the July 2008 and May 2011 highs (bold red line).
From this perspective, the picture remains bullish.
Now, let's zoom in on our picture of the oil market and see the weekly chart.
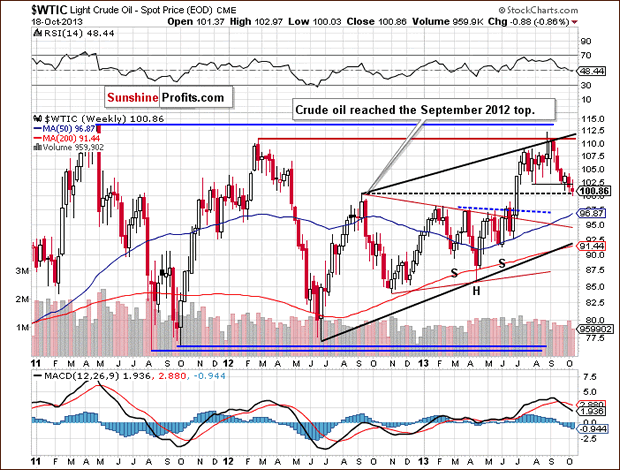
Looking at the above chart, we see that the price of crude oil declined once again in the previous week and dropped below the October low. In this way, light crude slipped to a new monthly low of $100.03 and closed last week at its lowest level since June. Yesterday, we saw further deterioration and the price dropped below the psychological barrier of $ 100 and hit its new monthly low of $99.41 per barrel.
In spite of this drop, from this point of view, the situation is mixed, because light crude reached the important medium-term support.
As you can see on the weekly chart, crude oil reached the September 2012 top (in terms of intraday highs) in the previous week. Yesterday, light crude extended declines and almost reached the September 2012 top in terms of weekly closing prices. This support level may encourage oil bulls to act and if this happens, we will likely see a pullback to around $104. However, if this zone is broken, the next target level for the sellers will be close to $97, where the 50-week moving average intersects with the previously-broken neck level of the reverse head and shoulders formation .
Before we summarize our today's essay, we have decided to examine the relationship between crude oil and the U.S. currency in the short term. At the beginning of the month crude oil prices were supported by a weaker U.S. dollar as commodities priced in the dollar became less expensive for holders of other currencies. Did this relationship remain in place in the following days? Let's take a closer look at the chart below.
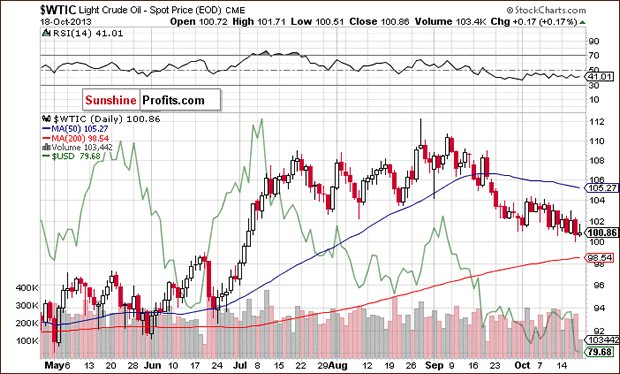
On the above chart we see that at the beginning of the month the dollar was under selling pressure as a U.S. government shutdown began. These circumstances resulted in a downward move, which took the U.S. currency to its lowest level since February. At the same time, crude oil rose to its monthly high of $104.38, which confirmed a strong relationship between them. However, it seems that in the following days this negative correlation waned. Although there were several days in which a stronger dollar triggered lower prices of crude oil, we almost immediately saw an invalidation of this tendency. Additionally, on Thursday, the dollar and crude oil dropped together. In case of crude oil, we saw a new monthly low. What's interesting, on the following day we also saw a new October low for the U.S. dollar.
Looking at the above chart, we see that a weaker U.S. dollar hasn't always been so bullish for crude oil. Please note that a big part of the June-July rally in light crude coincided with higher values of the dollar. We saw similar price action in both cases in mid-June, in August, and then again at the beginning of September. It seems that in this period of time, a stronger dollar pushed light crude higher, not lower. What's interesting, when the U.S. currency declined it usually triggered corrective moves in light crude in the following days. It was clearly visible at the beginning of September. Please note that the whole September-October decline in the dollar didn't result in a rally in crude oil. Therefore, we can conclude that although there are short periods of time when the price of light crude is supported by a weaker dollar, overall, they have been positively correlated in the recent months. If this relationship remains in place and we see a rebound in the greenback, we will likely see a pullback in crude oil in the following days as well.
Summing up, although crude oil dropped below the psychological barrier of $ 100, we saw it reach the September 2012 top, which is a medium-term support level. What's interesting, the USD Index dropped below the 80 level and also reached the medium-term support line. Therefore, it seems that further declines in both cases are quite limited.
Thank you.
Nadia Simmons
Sunshine Profits‘ Contributing Author
Gold Trading Tools and Analysis - SunshineProfits.com
* * * * *
Disclaimer
All essays, research and information found above represent analyses and opinions of Nadia Simmons and Sunshine Profits' associates only. As such, it may prove wrong and be a subject to change without notice. Opinions and analyses were based on data available to authors of respective essays at the time of writing. Although the information provided above is based on careful research and sources that are believed to be accurate, Nadia Simmons and his associates do not guarantee the accuracy or thoroughness of the data or information reported. The opinions published above are neither an offer nor a recommendation to purchase or sell any securities. Nadia Simmons is not a Registered Securities Advisor. By reading Nadia Simmons’ reports you fully agree that he will not be held responsible or liable for any decisions you make regarding any information provided in these reports. Investing, trading and speculation in any financial markets may involve high risk of loss. Nadia Simmons, Sunshine Profits' employees and affiliates as well as members of their families may have a short or long position in any securities, including those mentioned in any of the reports or essays, and may make additional purchases and/or sales of those securities without notice.
© 2005-2022 http://www.MarketOracle.co.uk - The Market Oracle is a FREE Daily Financial Markets Analysis & Forecasting online publication.