


Warning - Stocks Bull Market Major Top Forming
Stock-Markets / Stock Markets 2013 Oct 21, 2013 - 09:42 AM GMTBy: Andre_Gratian

 Current Position of the Market
SPX: Very Long-term trend - The very-long-term cycles are in their down phases, and if they make their lows when expected (after this bull market is over), there will be another steep decline into late 2014. However, the severe correction of 2007-2009 may have curtailed the full downward pressure potential of the 40-yr and 120-yr cycles.
Intermediate trend - SPX is back in a short-term uptrend.
Analysis of the short-term trend is done on a daily basis with the help of hourly charts. It is an important adjunct to the analysis of daily and weekly charts which discusses the course of longer market trends.
APROACHING BULL MARKET TOP?
Market Overview
Two weeks ago, I postulated the possibility that a bull market top appeared to be forming. In spite of the recent market short-term strength, that possibility still exists and the current market action could be the formation of an ending diagonal triangle or some other pattern which points to the end of the bull market.
Some supporting evidence comes from the NASDAQ 100 which appears to be in a blow-off mode, while the DOW industrials index is falling farther and farther behind the other indices. SPX, NDX and RUT have all made new all-time highs. The DOW is still trading some 300 points below its recent high. The last stages of the market advance are becoming more and more reminiscent of the 2000 blow-off in technical stocks!
It is not entirely clear if we are on the last leg of the bull market, or if there will be one more short-term correction followed by the final leg of the terminal impulse. Let's wait for more clarity and confirmation before making a specific forecast with conviction. Some ingredients are still lacking, such as the still mild readings of our favorite sentiment index, and the fact that the recent political stand-off in Washington did some damage to the economy and this is causing the Fed to hold off on its tapering decision. Could this prolong the topping process? Against that, we must weigh the impact of the approaching bottoming action of some major long term cycles which are due to make their lows in about a year. We'll have to see how these two major forces square off! Of one thing we can be certain: the market itself will tell us precisely when it is ready to have a major reversal.
Chart Analysis
This is an update of the weekly NDX which is still moving up exponentially in its blow-off stage. As you can see, this is still a work in process, with last week's big bullish spike providing a strong confirmation that this is, indeed, what NDX is doing. The indicated projection for the end of the move has almost been reached, but this could prove to be too conservative. We still have another week or two remaining in the current uptrend and, as mentioned earlier, after a short-term correction another up-leg is possible before the bull market comes to an end.
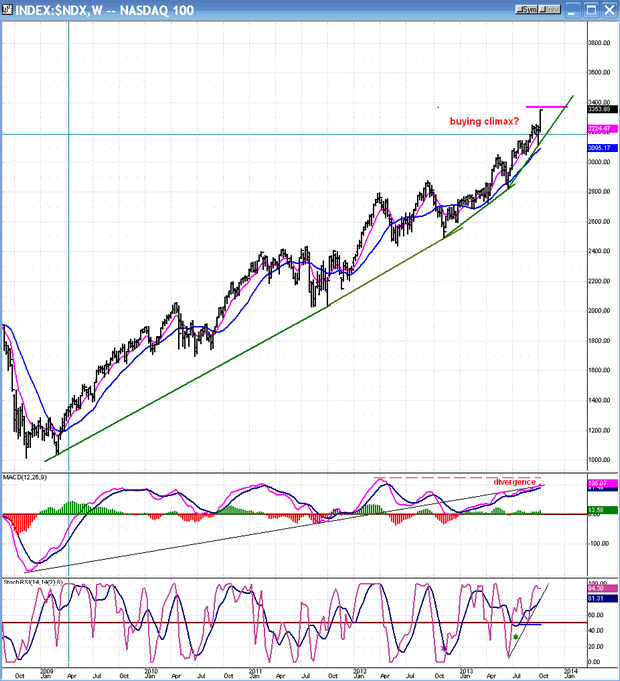
In spite of the price strength, the MACD is rising but is still under its March 2012 peak which is 560 index points lower. Putting it another way, the NDX has had a 20% increase in price since the time that its MACD made its former high, while the latter is 12% below the 3/12 high. Surely this, compared to the price action, should be a red flag for the bulls.
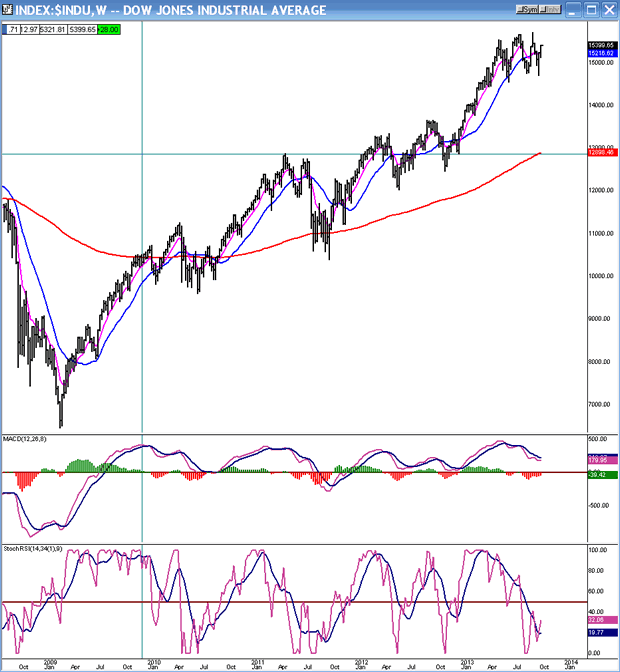
I'll next show the DOW industrials (below) during the same time period. Until May of this year, the two indices moved pretty much in tandem. But five months ago, the DJIA began to struggle in its quest for new highs, barely rising above the former ones during this time span. And finally, in the last month, the struggle became even more laborious with the net result that, as mentioned earlier, the DOW is still some 300 points under its last high.
It is difficult to see how these contrasting patterns can change radically over the next few weeks. And yet, this is what it would take to abort the present trend toward a bull market top.
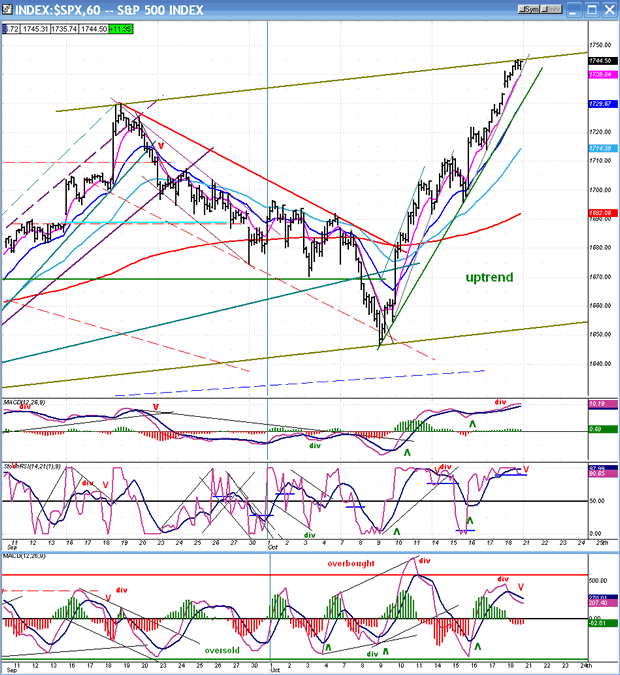
One more chart of the SPX hourly (below) will show the aggressive nature of the current uptrend which started well before the unfortunate political confrontation came to an end, totally ignoring the possibility of a default of our national debt.
Because the daily indicators are still positive, it is likely that the uptrend is not over. Besides, the projected target for this move has still not yet been reached. But there are some signs that the hourly trend is ready for a minor correction. For one thing, it has reached the resistance created by the parallel to a trend line drawn across the last two bottoms. Also, it has fulfilled a Fibonacci projection to that level.
Finally, the hourly oscillators are telling us that a correction is more than likely. The middle oscillator (SRSI) is overbought and starting to rolling over. The lower oscillator (A/D) has already started to decline and is showing some negative divergence to price. And the top one (MACD) does not have a dynamic look and is ready to make a bearish cross. The result of the total picture is that a minor pull-back is imminent.
Cycles
An important cycle high is due in the second week of November, so be ready for the end of this up-thrust to occur around that time frame!
We also should start to look for solid evidence that the longer term cycles are taking charge of the trend. Is the DOW the first to succumb to these longer-term pressures?
Breadth
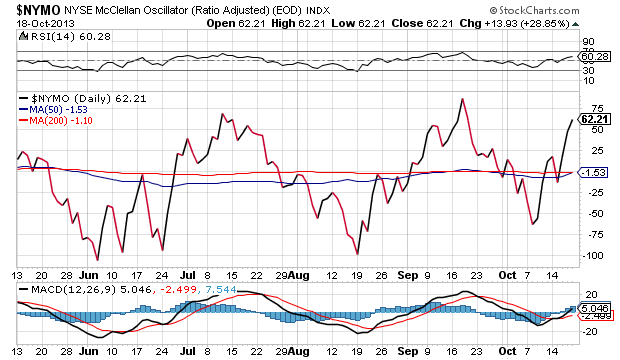
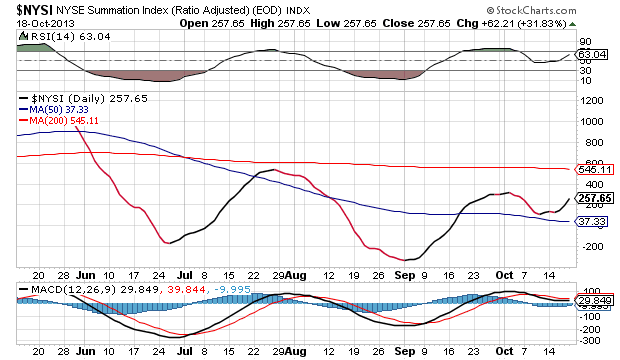
The McClellan Oscillator and Summation Index appear below (courtesy of StockCharts.com).
Looking at the hourly price chart of the SPX, you'd think that we are in a strong market. But if you consider the condition of the indicators below, especially the Summation Index, you may change your mind. Even the McClellan oscillator is already showing some negative divergence to the daily price by staying well below the previous peak while SPX has already made another all-time high. If we have a minor correction -- which I expect will start on Monday -- it will bring the oscillator back down and, as the market makes a potential final high, the negative divergence might even increase.
As for the NYSI, we don't have to guess about what's going to happen in the next couple of weeks. The picture is already very plain and red flags are sprouting everywhere. Be cautious! The next time it turns down, it could keep on going - much lower.
Sentiment Indicators
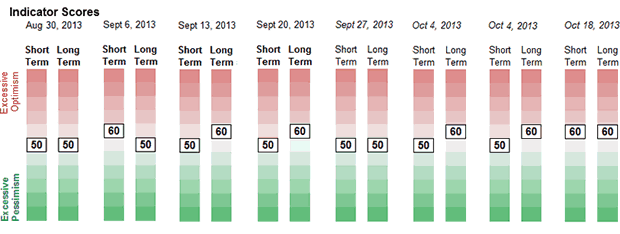
The SentimenTrader (courtesy of same) long-term indicator score remains at 60 for the second consecutive week. I would prefer to see it at 70 as an indication of a market top, and we may well see it there, still. For now, it's only a yellow flag.
VIX
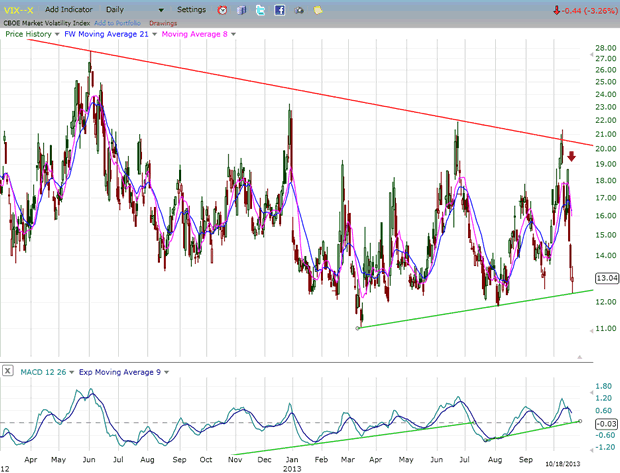
Last week, VIX lived up to its name by dropping precipitously from its recent high of 21.34 to a low of 12.34. Nevertheless, it remains at a higher level than its 3/14 low of 11.30 and its 8/5 low of 11.83, and if it holds last week's level, it will maintain its steady streak of higher lows against a market which is making new all-time highs nearly every month! So there is nothing here that would dissuade one from being concerned by the other red flags that I have been pointed out.
XLF (Financial Index)
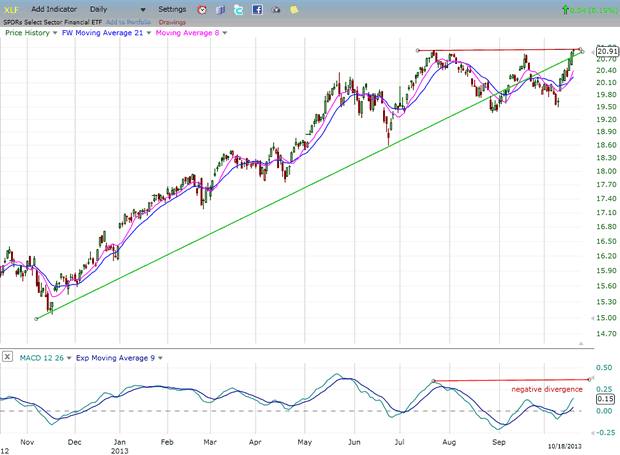
XLF is participating in the short-term rallies, but has yet to make an important new high along with SPX - although it came close last week. This keeps it in a relatively weak position and is another indication that all is not well with the long term uptrend.
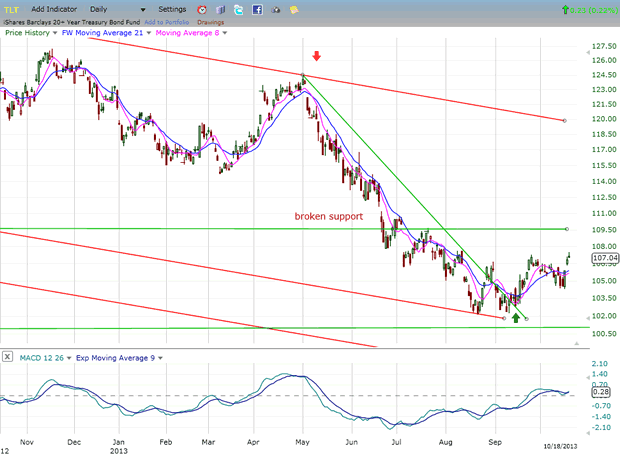
BONDS
TLT has made a short-term low in a long-term downtrend and is bouncing from an oversold condition. Its prospects for this to develop into a significant uptrend are not very good, and the choices are more likely to be those of extending its base or resuming the downtrend.
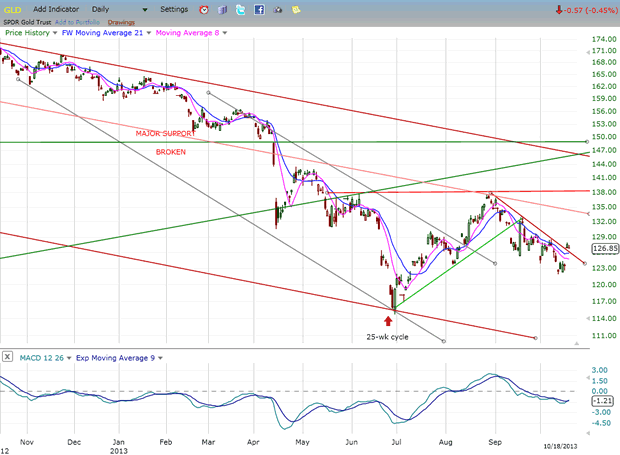
GLD (ETF for gold)
Gold is looking a little more bullish and may be ready to start a short-term uptrend which could take it to the vicinity of the previous broken support line. There, it will meet with strong resistance from a convergence of trend lines which should arrest its progress. The P&F chart gives it the potential for a move to 135-140, minimum. The extent of its move will largely depend on how much more weakness there is in the dollar. It is also past the mid-point of its 25-26 weeks cycle.
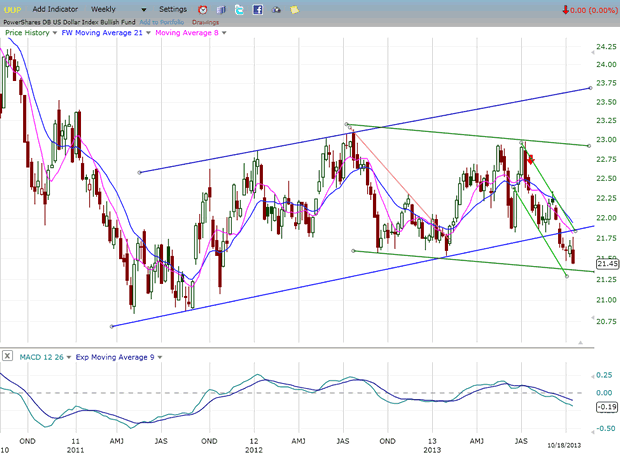
UUP (dollar ETF)
The dollar is clearly being affected by the decision of the Fed to put off tapering its bond purchases. The weekly chart shows that UUP has broken down from its intermediate (blue) up-channel and is currently moving in a wide (green) down-channel. It has almost reached the bottom of this declining channel and is also at the bottom of the smaller green channel that identifies its short-term trend. However, there is no sign of deceleration taking place in the MACD, so UUP's decline is likely not complete. We need to see more obvious signs of deceleration in its downtrend before it has a chance of turning back up.
USO (United States Oil Fund)
With the easing of tensions in the Middle-East, oil has come back down and USO has done the same -- ostensibly, correcting its recent advance. There is nothing at this time to suggest that it is ready to resume its uptrend.
Summary
The decision by the Fed to put off tapering its bond purchases has given the market some renewed hope that the bull market still has a ways to go. However, there are enough red flags being risen by the NASDAQ and the DOW (among others) to remain cautious about the possibility that a major top formation is taking place.
With a high expected in the second week in November by some cycle analysts, we should be particularly attentive to the market action around that time.
FREE TRIAL SUBSCRIPTON
If precision in market timing for all time framesis something that you find important, you should
Consider taking a trial subscription to my service. It is free, and you will have four weeks to evaluate its worth. It embodies many years of research with the eventual goal of understanding as perfectly as possible how the market functions. I believe that I have achieved this goal.
For a FREE 4-week trial, Send an email to: ajg@cybertrails.com
For further subscription options, payment plans, and for important general information, I encourage
you to visit my website at www.marketurningpoints.com. It contains summaries of my background, my
investment and trading strategies, and my unique method of intra-day communication with
subscribers. I have also started an archive of former newsletters so that you can not only evaluate past performance, but also be aware of the increasing accuracy of forecasts.
Disclaimer - The above comments about the financial markets are based purely on what I consider to be sound technical analysis principles uncompromised by fundamental considerations. They represent my own opinion and are not meant to be construed as trading or investment advice, but are offered as an analytical point of view which might be of interest to those who follow stock market cycles and technical analysis.
Andre Gratian Archive |
© 2005-2022 http://www.MarketOracle.co.uk - The Market Oracle is a FREE Daily Financial Markets Analysis & Forecasting online publication.