


Gold Price Trend Forecast Into the End of 2013
Commodities / Gold and Silver 2013 Oct 07, 2013 - 10:09 AM GMTBy: Clive_Maund

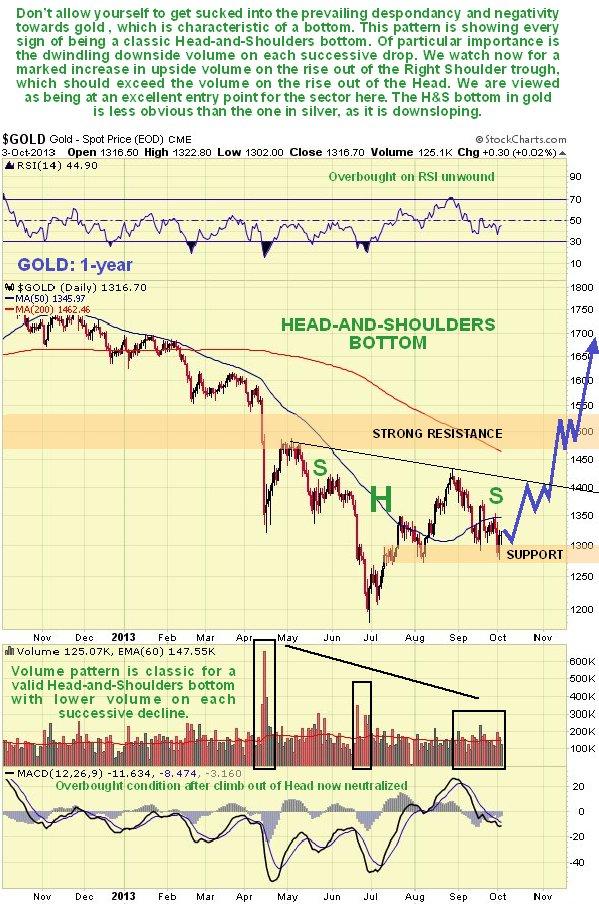
 The reason for posting a new Gold Market update at this juncture is that we appear to be at an optimum 'buy spot', for gold, silver and Precious Metals ETFs and stocks, as both gold and silver have dropped back in recent weeks to mark out the Right Shoulder low of what is believed to be a large Head-and-Shoulders bottom.
After posting the 1-year chart for gold shown below on clivemaund.com a couple of days ago, a subscriber wrote and protested, saying how could I recommend buying the sector when it hasn't even completed the H&S pattern, which could abort, and that it would be far better to wait for a breakout, and then buy on a post breakout pullback. There are 2 points I would like to make about this. The first is that if we can be pretty sure this H&S pattern is valid, then why wait until gold is $100 higher to buy? The second point is that because we have clearly defined support right beneath the current price, we thus have an excellent risk/reward ratio, because we have the option of placing stops beneath this support. If the interpretation that this H&S bottom is valid, then gold is going a lot higher from here, and we will be in for most of the ride, if incorrect, we are out for a trivial loss. The experienced pure trader will instantly recognize this as an acceptable and attractive setup. The fact that a lot of investors are moaning about how awful the PM sector is and how they have no confidence that it will ever perform again is great to hear, because this is just the mood we expect to prevail at an important market bottom.
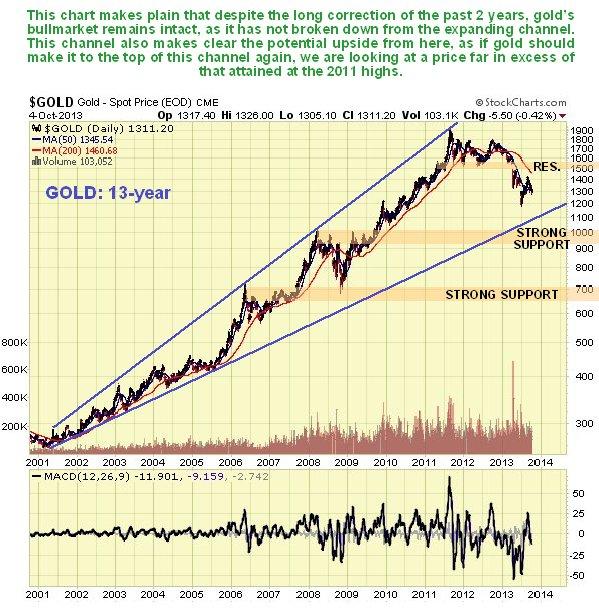
The long-term 13-year chart is, or should be, most heartening for gold bulls as it shows that the long-term uptrend remains intact and further that upside potential from here is very substantial, which should not be so surprising given that the cornered Fed has no choice but to continue with QE or even expand it, unless that is it wants to watch the markets implode and the economy collapse.
The latest COTs for gold (not shown) are bullish, although not at the bullish extremes that we saw late June - early July.
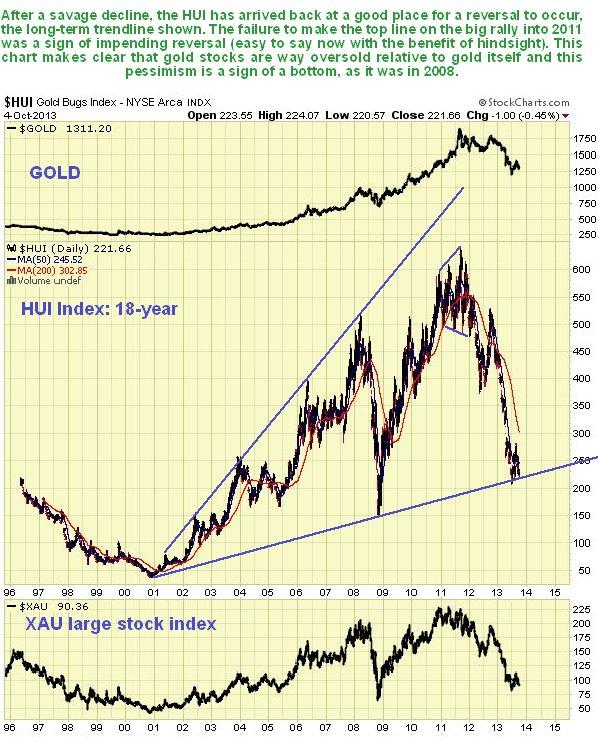
We can see the battering that the PM sector has suffered on the long-term 18-year chart for the HUI index below. It is now not that far above its 2008 panic lows, which means that it is way oversold relative to gold, which is still getting on for twice its price at its 2008 lows. Here we should remind ourselves that at times of extreme optimism characteristic of a top, stocks are more popular than bullion, while at times of extreme pessimism characteristic of a bottom, bullion is more popular than stocks (or less unpopular), which is what we are seeing right now.
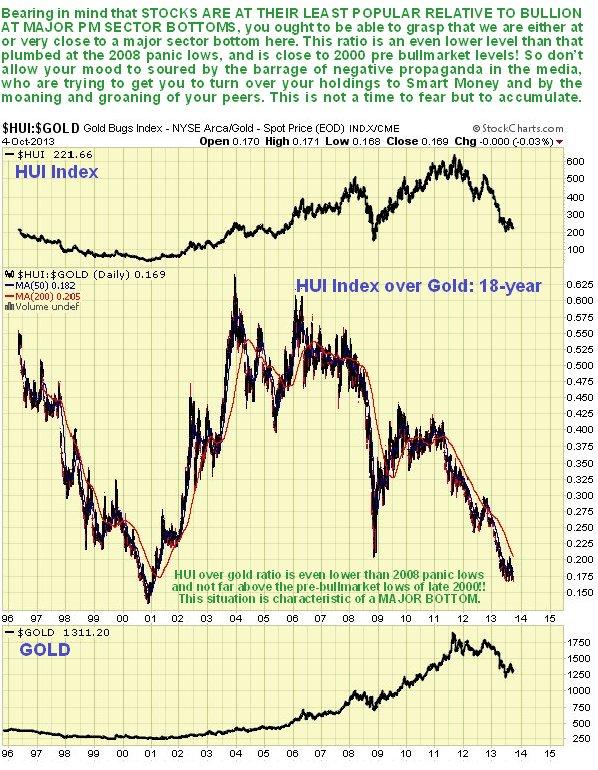
We can of course chart this mood swing between stocks and bullion by simply plotting one divided by the other as shown below. This startling chart of the HUI index over gold reveals that this ratio is even beneath its level at the 2008 panic lows - and we know what happened after that - and is incredibly approaching its level in late 2000, which is before the gold bull market even began! Go back again and compare the price of gold now to what it was back in late 2000 at the top of the chart above and you should be able to appreciate how out of whack and mad this is. It strongly suggests that the sector is forming a major bottom here, because let me assure you that there is going to be a gold mining business in the future.
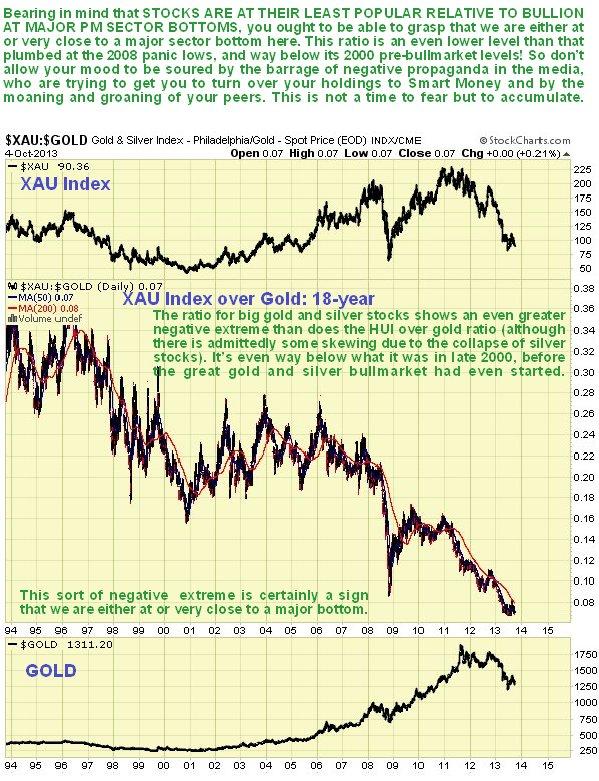
The situation for the big gold (and silver) stocks relative to gold is even worse (better for buyers), as the 20-year chart for the XAU index plotted over gold below makes clear. This shocking chart shows that big gold and silver stocks are far more undervalued relative to gold not just than they were at the 2008 panic low, but than they were at the late 2000 low pre the gold and silver bullmarket. This is again another strong indication that we are either at, or very close to the lows. Here we should note that if the broad market tanks soon, the PM sector, which has been performing contra-cyclically to the broad stockmarket all year, and has already tanked, is expected to continue to perform contra-cyclically and rally.
I am going to end this with a very important message. We have seen that gold and silver are very probably completing Head-and-Shoulders bottom reversals, with prices having dropped down to suspected Right Shoulder low buy spots. In addition, and most importantly, we have seen for ourselves in this update the insane undervaluation of stocks relative to bullion, which is characteristic of a major sector bottom. What this means is that you can go ahead and buy large and mid-cap gold stocks now, and juniors with strong balance sheets that are either producers or close to production, with confidence, and quit worrying about day to day price movements afterwards, because you know that you are buying either at or very close to a major low. So rather than buy the sector and then sit on the edge of your chair biting your nails as you staring at changing prices on the screen, do what Smart Money does, buy them, bank them, and then go fishing or playing golf or whatever you enjoy doing with your leisure time, confident that you have bought stocks that are ludicrously undervalued and that it is only a matter of time before they rally to become more fairly valued.
By Clive Maund
CliveMaund.com
For billing & subscription questions: subscriptions@clivemaund.com
© 2013 Clive Maund - The above represents the opinion and analysis of Mr. Maund, based on data available to him, at the time of writing. Mr. Maunds opinions are his own, and are not a recommendation or an offer to buy or sell securities. No responsibility can be accepted for losses that may result as a consequence of trading on the basis of this analysis.
Mr. Maund is an independent analyst who receives no compensation of any kind from any groups, individuals or corporations mentioned in his reports. As trading and investing in any financial markets may involve serious risk of loss, Mr. Maund recommends that you consult with a qualified investment advisor, one licensed by appropriate regulatory agencies in your legal jurisdiction and do your own due diligence and research when making any kind of a transaction with financial ramifications.
Clive Maund Archive |
© 2005-2022 http://www.MarketOracle.co.uk - The Market Oracle is a FREE Daily Financial Markets Analysis & Forecasting online publication.