


Reasons for U.S. Income Inequality
Politics / Social Issues Sep 27, 2013 - 10:41 PM GMTBy: Richard_Mills

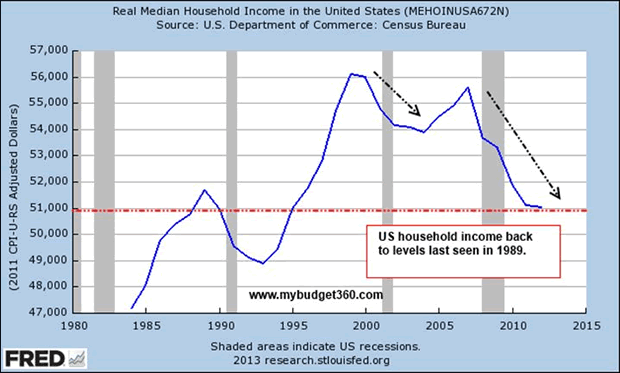
 Pulitzer Prize-winning journalist David Cay Johnston says the incomes of the bottom 90 percent of Americans, after being adjusted for inflation, grew by only $59 on average between 1966 and 2011, over the same period the average income of the top 10 percent of Americans grew by $116,071.
A 2011 study from the Congressional Budget Office (CBO) reported incomes for the bottom fifth of Americans grew 20 percent between 1979 and 2007. Members of the top one percent saw their incomes grow by 275 percent during the same period,
The U.S. top one percent of income earners accounted for 17 per cent of national income in 2010 - the top one percent in Canada took in 10.6 per cent of national income in 2010.
In the U.S. the average income of someone in the top 10 percent of income earned was 15.9 times greater than the average income of someone in the bottom 10 per cent of the income distribution - the Canadian ratio is 8.9 percent.
Income inequality figures would be much worse except that:
- Women moved into the workforce, most households have two incomes
- We're working 500 hours a year more than in 1979
- Households drew down savings and borrowed against the equity in their homes to maintain living standards
Yet even after all this...
U.S. households, on average owe 138 per cent of their after-tax income and even worse off are Canadians, on average Canadians owe 165 per cent of after-tax income.
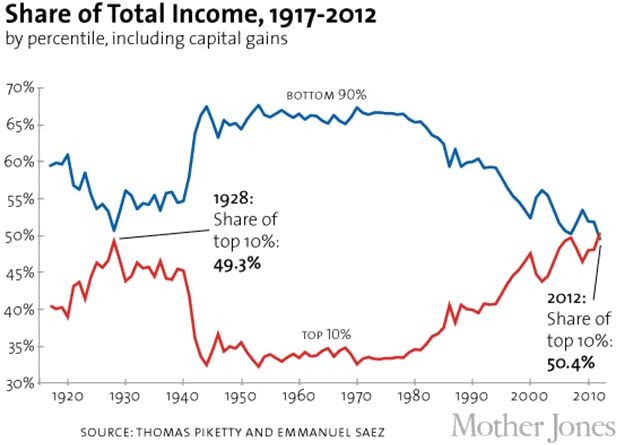
"The top 1 percent took more than one-fifth of the income earned by Americans, one of the highest levels on record since 1913, when the government instituted an income tax. The figures underscore that even after the recession the country remains in a new Gilded Age , with income as concentrated as it was in the years that preceded the Depression of the 1930s, if not more so." ~ Ex-Labor Secretary, Robert B. Reich ' The Rich Get Richer Through the Recovery'
What is causing the rising inequality of incomes and wages?
"Executives constitute a larger group of workers than is commonly recognized, and the extraordinary pay increases received by chief executive officers of large firms had spillover effects in pulling up the pay of other executives and managers. Consequently, the growth of CEO and executive compensation overall was a major factor driving the doubling of the income shares of the top 1.0 percent and top 0.1 percent of households from 1979 to 2007." ~ Bivens, Josh, and Lawrence, Mishel. 2013. "The Pay of Corporate Executives and Financial Professionals as Evidence of Rents in Top 1 Percent Incomes" Journal of Economic Perspectives
From 'CEO Pay in 2012 Was Extraordinarily High Relative to Typical Workers and Other High Earners' by Lawrence Mishel and Natalie Sabadish we get the following:
-
From 1978 to 2012, CEO compensation measured with options realized increased about 875 percent, a rise more than double stock market growth and substantially greater than the painfully slow 5.4 percent growth in a typical worker's compensation over the same period.
-
Using the same measure of options-realized CEO pay, the CEO-to-worker compensation ratio was 20.1-to-1 in 1965 and 29.0-to-1 in 1978, grew to 122.6-to-1 in 1995, peaked at 383.4-to-1 in 2000, and was 272.9-to-1 in 2012, far higher than it was in the 1960s, 1970s, 1980s, or 1990s.
-
Measured with options granted, CEOs earned 18.3 times more than typical workers in 1965 and 26.5 times more in 1978; the ratio grew to 136.8-to-1 in 1995 and peaked at 411.3-to-1 in 2000. In 2012, CEO pay was 202.3 times more than typical worker pay, far higher than it was in the 1960s, 1970s, 1980s, or 1990s.
-
Over the last three decades, CEO compensation grew far faster than that of other highly paid workers, those earning more than 99.9 percent of other wage earners. CEO compensation in 2010 was 4.70 times greater than that of the top 0.1 percent of wage earners, a ratio 1.62 higher (a wage gain roughly equivalent to that of 1.6 high wage earners) than the 3.08 ratio that prevailed over the 1947-1979 period.
According to data compiled by the AFL-CIO, the average CEO pay at 327 of the nation's biggest companies is $12.3 million when you include salaries and all other incentives.
That's $7,000 an hour or 350 times the average workers per hourly wage of $20 in the U.S. The ratio of CEO pay to average worker pay in:
- Canada - 204
- Germany - 147
- U.K. - 84
- Japan - 67
The average U.S. worker makes $35,204 a year. The CEO at 327 of America's biggest corporations works 5 hours to make what the average American worker makes in a year.
That's average salaries I'm using, not median, which would of course be much lower - the average salary includes large white collar pay checks.
The 100 top-paid CEO's of companies listed on the Toronto Stock Exchange's composite index were projected to earn, by noon of the first working day of 2012, $44,366. That's quicker than in 2009 when they had to sweat it out till 2:30. The average Canadian's salary was $47,200 in 2012.
Conclusion
"The middle-class America of my youth is best thought of not as the normal state of our society, but as an interregnum between Gilded Ages." ~ Paul Krugman 'For Richer' The New York Times
Krugman's article, although dated October 2002, is a must read.
Deng Xiaoping, who was China's first leader after Mao said "Some should be allowed to get rich first." Sounds like our western plutocrats took that bit of wisdom to heart and waddled to the trough with it.So get in line, although in times of such lop-sided income inequality you might be waiting a while.
The air stinks when you're in a herd, the water tastes terrible, the view is monotonous and the grazing, when you finally get to it, is to say the least not the most succulent or tastiest. Being all wrapped up in Honey Boo Boo's (or the bearded wonders on Duck Dynasty) latest escapades keeps the herd enthralled and complacent and the circus plays on.
You need to become an outside the herd animal and put your family's financial health and safety on your radar screen.
Is getting ahead of the herd on your radar screen?
If not, maybe one should be.
By Richard (Rick) Mills
If you're interested in learning more about the junior resource and bio-med sectors please come and visit us at www.aheadoftheherd.com
Site membership is free. No credit card or personal information is asked for.
Richard is host of Aheadoftheherd.com and invests in the junior resource sector.
His articles have been published on over 400 websites, including:
Wall Street Journal, Market Oracle, USAToday, National Post, Stockhouse, Lewrockwell, Pinnacledigest, Uranium Miner, Beforeitsnews, SeekingAlpha, MontrealGazette, Casey Research, 24hgold, Vancouver Sun, CBSnews, SilverBearCafe, Infomine, Huffington Post, Mineweb, 321Gold, Kitco, Gold-Eagle, The Gold/Energy Reports, Calgary Herald, Resource Investor, Mining.com, Forbes, FNArena, Uraniumseek, Financial Sense, Goldseek, Dallasnews, Vantagewire, Resourceclips and the Association of Mining Analysts.
Copyright © 2013 Richard (Rick) Mills - All Rights Reserved
Legal Notice / Disclaimer: This document is not and should not be construed as an offer to sell or the solicitation of an offer to purchase or subscribe for any investment. Richard Mills has based this document on information obtained from sources he believes to be reliable but which has not been independently verified; Richard Mills makes no guarantee, representation or warranty and accepts no responsibility or liability as to its accuracy or completeness. Expressions of opinion are those of Richard Mills only and are subject to change without notice. Richard Mills assumes no warranty, liability or guarantee for the current relevance, correctness or completeness of any information provided within this Report and will not be held liable for the consequence of reliance upon any opinion or statement contained herein or any omission. Furthermore, I, Richard Mills, assume no liability for any direct or indirect loss or damage or, in particular, for lost profit, which you may incur as a result of the use and existence of the information provided within this Report.
Richard (Rick) Mills Archive |
© 2005-2022 http://www.MarketOracle.co.uk - The Market Oracle is a FREE Daily Financial Markets Analysis & Forecasting online publication.