


Dow Jones Upside Break May be a Head Fake
Stock-Markets / Stock Markets 2013 Sep 19, 2013 - 03:21 AM GMTBy: Brian_Bloom

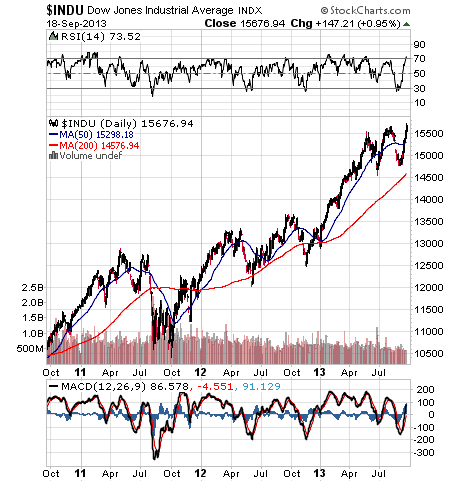
 To begin with, attention is drawn to the positions of the RSI and MACD on the chart below (stockcharts.com). The RSI is overbought and the MACD has failed to rise to a new high. Technically speaking, this is a meaningful non-confirmation
Attention is now drawn to the article associated with today’s Associated Press headline: http://finance.yahoo.com/news/fed-delays-bond-tapering-wants-180106376.html
“Fed delays bond tapering, wants to see more data”
Quote:
“…. the Fed says that the economy is growing moderately and that some indicators of labor market conditions have shown improvement. But it noted that rising mortgage rates and government spending cuts are restraining growth.”
Translation: To date, the $85 billion a month injection into the economy has not been working as we would have liked.
Question: Would a continuation of the QE translate to a stimulation of government spending?
Answer: We won’t know until after the debt ceiling talks have been resolved. The market seems to be betting that Congress will approve continued spending along with a debt increase
Question: Would a continuation of QE translate to a stimulation of private sector borrowing?
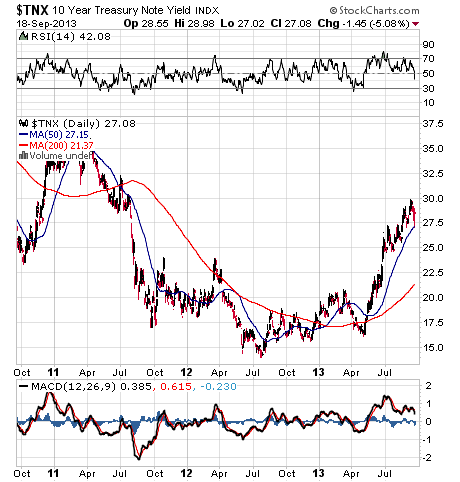
Answer: Not unless interest rates head downwards again (ten year yields have been rising)
Observation: This optimism belies what the Republicans are saying about raising the debt ceiling and what some Democrats in Congress are doing. The Republicans are saying that they will not approve a raised debt ceiling unless health care cost cuts are implemented. President Obama is saying that he won’t negotiate on that. The rogue Democrats may desert Obama and agree with the Republicans in order to keep the wheels of the economy turning. But a cut in health care spending will reduce overall government spending which, in turn, will take the pressure off the economic accelerator pedal.
Interim Conclusion
We will know the outcome within a couple of weeks but, based on what the media is reporting regarding the debt ceiling discussions, today’s spike in the Dow may have been a head fake. Investor optimism may be based more on hope than on reality.
Let’s now look at some fundamentals
Unemployment statistics:
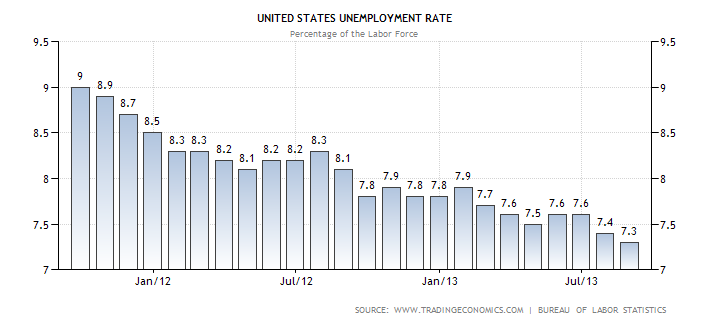
9% - 7.3% = 1.7% improvement since October 2011.
Labour participation statistics (from October 2011) http://data.bls.gov/timeseries/LNS11300000

64.1 – 63.2 = 0.9% deterioration
Public Debt: http://www.treasurydirect.gov/NP/debt/search?startMonth=10&startDay=01&startYear=2011&endMonth=08&endDay=30&endYear=2013
· As at October 1st 2011: $14.8 trillion
· As at August 30th 2013: $16.7 trillion
Change: $1.9 trillion rise in 22 months
Annualised: 24/22 X 1.9 = $2.07 = 2 years
Average annual increase: $1.04 trillion
· As at December 30th 2011: $15.2 trillion
· As at December 31st 2012: $16.4 trillion
Change: $1.2 trillion in one year
Observation: Rate of increase of public debt is slowing
Reserve Bank pumping (QE in millions of dollars) – movement to September 5th 2013:
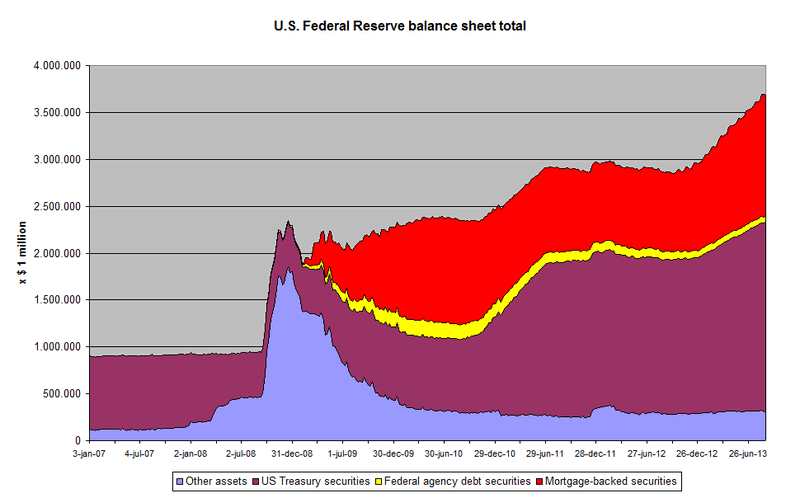
Approximate historical increase since October 2011: +$ 0.7 trillion in 2 years. Current rate of increase at $85 billion a month = $1 trillion p.a.
US Nominal GDP: (http://www.measuringworth.com/datasets/usgdp/result.php )
Year |
Nominal GDP (million of Dollars) |
Plot Series Plot Log of Series
|
|
2011 |
15,533,800 |
2012 |
16,244,600 |
Growth in nominal dollars: 2012/2011 = $0.7 trillion in one year (Comparable 2013 statistics not yet available)
Summary:
· Average annual increase of public debt of $1 trillion has given rise to less than $1 trillion p.a. increase in GDP 2012/2011.
· Since December 2012, the Fed’s balance sheet has been increasing at $1 trillion p.a. rate, and the unemployment rate has decreased by 0.5%, whilst the participation rate has fallen by 0.4%
Observation:
The above evidences the fact that Fed activity and US Government deficit spending has effectively been burning rubber to keep the economic vehicle from going backwards. Unless the economy starts to grow at a rate in excess of $1 trillion p.a. (1/16.2 = 6% p.a.), growth in corporate profits will be dependent on growth in overseas income.
What is happening on the global front?
The weekly Global Dow Chart below shows a breakup to new high but still below 2007/8 high
Overall Conclusion
Weight of funds and loose money/credit policies have been driving the markets upwards in the hope that the global economy gains traction. So far, in the US, it has been requiring a dollar of money/credit growth to generate less than a dollar economic growth. All eyes need to be on the coming negotiations regarding raising the US Debt ceiling. It will need to be raised by over $1 trillion to keep the economic ship afloat. What are the probabilities? The probabilities seem to favour a trade-off between spending cuts and raised debt ceiling. The chart of the US Dow Industrials shows indecision with a slight bias towards negativity because it is technically overbought and due for a pullback. Therefore, the breakup of the Dow following the Fed announcement that it will maintain QE may be a head fake. We are living in an extremely high risk investment environment.
Final Observation
At the end of the day, meaningful economic growth is driven by meaningful value-add activity. All the central bank jawboning is just “noise”. The key question is whether the next generation of technological advancements will have the gravitas – and will be commercialised quickly enough - to drive the economy. Time will tell. The GDOW chart is not yet looking sufficiently optimistic to make that call. The appropriate stance is therefore one of defensiveness.
Author, Beyond Neanderthal and The Last Finesse
Beyond Neanderthal and The Last Finesse are now available to purchase in e-book format, at under US$10 a copy, via almost 60 web based book retailers across the globe. In addition to Kindle, the entertaining, easy-to-read fact based adventure novels may also be downloaded on Kindle for PC, iPhone, iPod Touch, Blackberry, Nook, iPad and Adobe Digital Editions. Together, these two books offer a holistic right brain/left brain view of the current human condition, and of possibilities for a more positive future for humanity.
Copyright © 2013 Brian Bloom - All Rights Reserved
Disclaimer: The above is a matter of opinion provided for general information purposes only and is not intended as investment advice. Information and analysis above are derived from sources and utilising methods believed to be reliable, but we cannot accept responsibility for any losses you may incur as a result of this analysis. Individuals should consult with their personal financial advisors.
Brian Bloom Archive |
© 2005-2022 http://www.MarketOracle.co.uk - The Market Oracle is a FREE Daily Financial Markets Analysis & Forecasting online publication.