


Stock Market Update: Gotta Have Faith
Stock-Markets / US Stock Markets Apr 07, 2008 - 08:25 AM GMTBy: Dominick
 In typical fashion, the week closed at a crucial area that will determine whether there's still one more new high in this rally or it's now time for consolidation, leaving the decision to next week. Still, we have the ultimate resistance level for this move and the numbers below that will trigger a more serious correction.
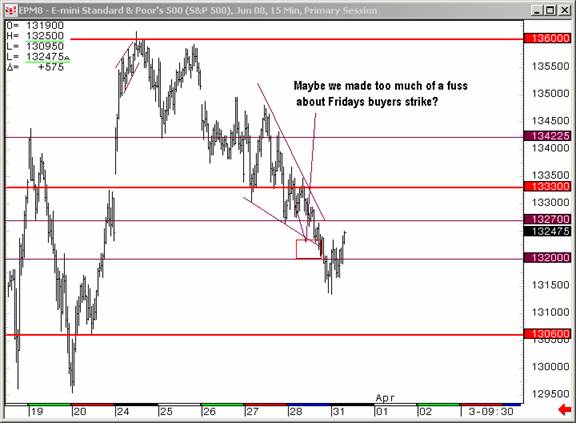
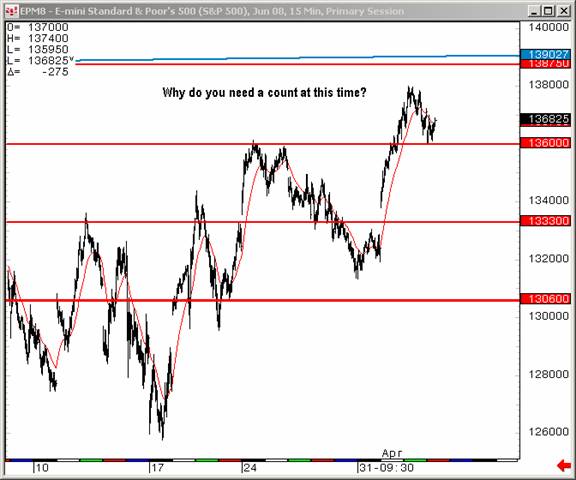
Ironically, the sentiment this weekend is decidedly more bullish than last week. Remember that despite the overwhelmingly bearish attitude amongst traders after the previous week's close saw the indices slip to their lows, my last update said our trading this week would be based on charts that “suggest the market is closer to near term support than falling over the proverbial cliff.” As the chart above shows Monday morning found support at a double bottom and rallied strongly – not the first low we've bought.
But, though the first day of the week did end higher, it was with renewed selling pressure that again had the bears eager to short ahead of a collapse. Instead, we believed price was retreating in the final move of a wave 2 retracement and that the situation would be clarified in overnight Globex trading. Sure enough, Globex found support at 1315 and rallied to 1333.25, which was near enough to our longstanding 1333 pivot to have us TMAR (take the money and run).
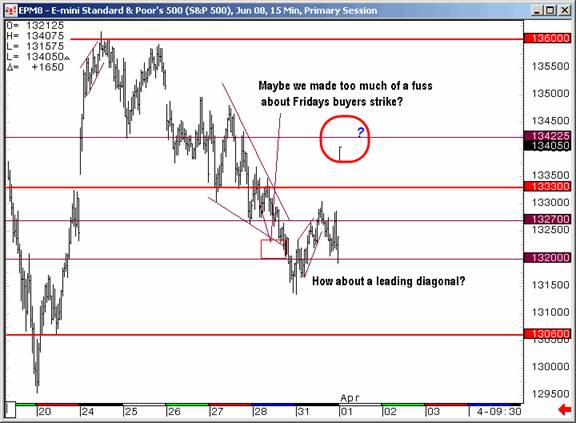
Taking profits is always nice, but members around the world trading that Globex session with me were advised to re-enter longs on any price improvement above 1333. If our interpretation of Monday's close as a wave 2 retracement was to be confirmed, it would mean a powerfully impulsive wave 3 was due to follow. And though the bearish sentiment was ripe for a squeeze, there would have to be some catalyst to trigger an explosive rally. As so often happens, news “coincidentally” appeared to make the predictions of Elliott wave come true. In this case it was the Lehman Bros. share offering which, as it was digested that night, came to be seen as a sign Bear Sterns' implosion would be the worst of the credit crisis. As you can see from the chart above, Tuesday's huge gap open got the wave 3 rally started nicely.
There are many traders who doubt technical analysis and the Elliott wave principal, but what I see in chart above is fundamental traders trying to rationalize away the rally on Lehman's dubious equity dilution. As you know, Tuesday's session ground higher and higher all day while the doubters looked for opportunities to fade the move, only to be completely run over with every new leg upward. At 4:30 Tuesday afternoon, the market was 50 points higher than the previous close, a fitting reward for those with faith in their charts. Perhaps more importantly, though, the rally had gotten us above an important line in the sand that had us at first constructive for further gains.
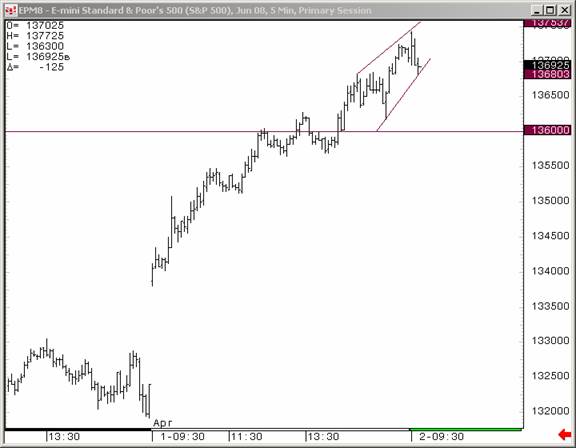
As mentioned several times recently, its important to understand short term trades in context of the big picture. The chart above show that while looking for Wednesday's market to extend it's gains, at least intraday, long term resistance loomed above and this would probably be the trigger for a fourth wave consolidation.
Though Elliott wave theory is an important part of our technical analysis, it is not our only means of understanding markets and planning trades. The March 23 update, in particular, emphasized the value of our proprietary targets. The chart above shows that while Elliott purists scrambled to count the internals of a fourth wave, we relied on price action at our numbers to paint our attitude about the market and to get in and out of positions.
Even though support materialized perfectly at one of our target levels, most of the Street was getting cautious ahead of Friday's job's and unemployment data. As you might expect, we didn't have much of an opinion about the report either way, but expected price action on our charts to give us reliable information to trade. Friday morning's Globex session was another useful exercise, as futures ping-ponged between our numbers. Just ahead of the data, the market had rallied to within five points of our final target, where we had sells orders waiting. Despite the worse than expected report, the market quickly jumped to tag our number, get us in short, and then decline 20 points in a single five-minute bar – not a bad way to start the day!
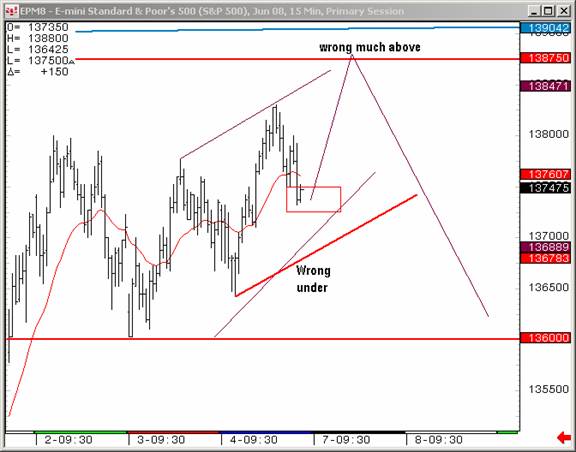
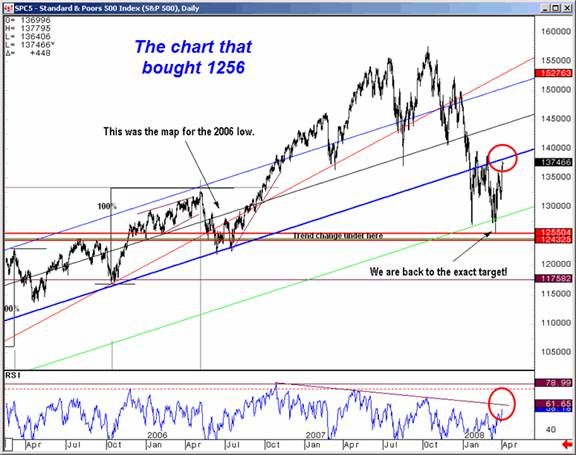
Friday's session affirmed the Globex activity with one important difference: the new highs intraday never quite extended to our final target level for the move and instead ended just above a key technical level that would suggest further consolidation. The market therefore remains poised to move in either direction. Members and astute readers of this update know our levels below that could open the door to a violent correction, or act as support and confirm a more bullish outlook. But in any outcome, having faith in our charts and analysis of them, we believe we have the key information that will guide us to profitable trades.
Are you ready to breakout from bias and trade these volatile markets come what may? The opportunity to join the TTC community of traders is slipping away from retail investors. We originally thought we would close the doors to new retail in June or July, but I've decided to move that up closer to May 31, Memorial Day weekend. If you're really serious about trading learn more about what TTC has to offer and how to join now .
So, do you want to learn how to trade short term time frames? Would you like access to next week's charts posted in the weekly forum right now? Ten to twenty big picture charts are posted every weekend. If you feel the resources at TTC could help make you a better trader, don't forget that TTC will be closing its doors to new retail members on May 31,2008 . Institutional traders have become a major part of our membership and we're looking forward to making them our focus.
TTC is not like other forums, and if you're a retail trader/investor looking to improve your trading, you've never seen anything like our proprietary targets, indicators, real-time chat, and open educational discussions. But the only way to get in is to join before the lockout starts - once the doors close to retail members, we'll use a waiting list to accept new members from time to time, perhaps as often as quarterly, but only as often as we're able to accommodate them. Don't get locked out later, join now.
Have a profitable and safe week trading, and remember:
"Unbiased Elliott Wave works!"
By Dominick , a.k.a. Spwaver
www.tradingthecharts.com
This update is provided as general information and is not an investment recommendation. TTC accepts no liability whatsoever for any losses resulting from action taken based on the contents of its charts, commentaries, or price data. Securities and commodities markets involve inherent risk and not all positions are suitable for each individual. Check with your licensed financial advisor or broker prior to taking any action.
Dominick Archive |
© 2005-2022 http://www.MarketOracle.co.uk - The Market Oracle is a FREE Daily Financial Markets Analysis & Forecasting online publication.