


Gold Lower Highs and Lows Signals Bearish Trend
Commodities / Gold & Silver Apr 06, 2008 - 10:17 AM GMTBy: Merv_Burak

 Although the week started horrible it ended on an up note. Now the question is, “will the up note continue”? The step manner of the recent decline should be fodder for Elliott Wave analysts but I'll just keep it simple.
GOLD : LONG TERM
Well, the long term P&F chart has been bullish for some time now and finally is in a precarious position. It has not yet given a reversal signal to the bear but is getting close. For those of you who do not know my criteria for the issuance of a P&F reversal signal it's quite simple. In this case, to give a bear signal the chart must break below the established up trend line and below two previous lows. Well, it had broken below two previous lows earlier (at $900) but had not moved below the up trend line.
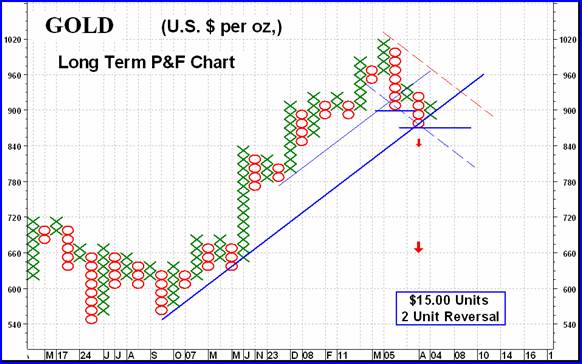
It touched the up trend line this past week but rebounded. The move NOW has to go below the up trend line and the new lows. That would mean a move to the $870 level to meet the two requirements. The breaking of support levels has, however, given us downside projections should the move confirm the bear trend. Those projections are to the $840 and then the $660 levels. Once the move becomes a confirmed bear then we might have a new lower projection to at least the $600 level, but let's take it one step at a time. We're not yet at the confirmed bear trend yet.
I should make note of the fact that the recent activity DID break below a secondary up trend line (the thin blue line) and therefore we had our dual reversal signal when the price broke to the $900 level. The more aggressive investor might take this as the reversal signal. I often use a secondary trend line in place of the primary line in my criteria for a reversal BUT the action should be far above the primary line. The break here, at $900, was just above the primary trend line so I remain with the primary as the signal line in this case.
As for our normal indicators, they are still well entrenched on the positive side. The gold price continues to trade above its long term positive sloping moving average line. The long term momentum indicator remains above its neutral line, inside its positive zone. However, the direction of the momentum indicator is towards the down side and it is below its negative sloping trigger line. This is an early warning indication and about the only negative among the indicators. The volume indicator also remains above its positive sloping long term trigger line. Putting all of that together I can only maintain the long term rating as BULLISH .
INTERMEDIATE TERM
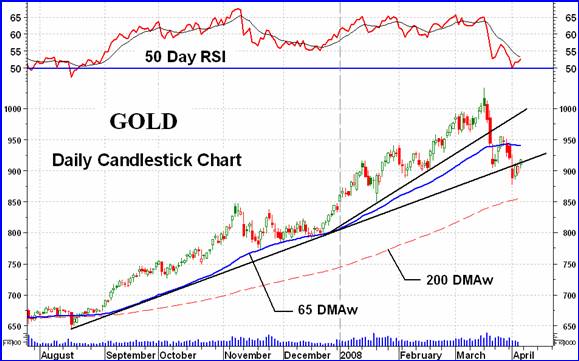
Shown in the chart is the third FAN trend line (from the August low) discussed often over the past few weeks, along with the less often developed fourth FAN trend line. The breaking of this more aggressive fourth FAN trend line was the end of the blow-off stage in the upward trend while the breaking of the third FAN trend line was the confirmation of such reversal. The break in the third trend line has been swiftly nullified by the end-of-week bounce in the gold price. The bounce does not look strong and unless it strengthens in the days ahead its longevity is suspect.
What we see here in the normal indicators is a price action that is below its intermediate term moving average line and the line has now turned negative. The momentum indicator is bouncing off its neutral line and is still inside its positive zone but below its negative sloping trigger line. The two, indicator and trigger, are converging pretty fast so they may cross again but it's the slope of the trigger that I look at for confirmation of the direction of the indicator. Putting it all together and despite the momentum still being slightly in the positive zone I must rate the intermediate term as BEARISH at this time.
SHORT TERM
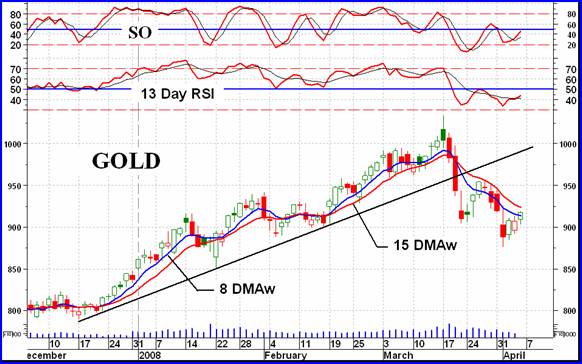
As mentioned in the introduction at the top of this commentary, the step pattern of recent gold price activity may be very important to Elliott Wave analysts but I'll just keep it simple. As long as the pattern remains lower lows and lower highs there is no argument that we are in a short term down trend. How far will it go or even if it will continue is another question. So far the rally at the latter end of the week has not been impressive. It appears weaker than the short rally of a week or two ago. However, it is a rally and it could turn into a new trend so let's take a look at the indicators to see what we see.
First the short term. The price of gold has rallied almost to the negative sloping short term moving average line, but it's been there before. The short term momentum indicator is still in its negative zone but has changed its direction to the up side by crossing above its trigger line with the trigger turning upward. At the present time I must still rate the short term as BEARISH although it is starting to improve.
Looking at the very short term, or as I used to call it, the immediate term we get an improving picture. Gold has closed above its very short term moving average line but the line has not yet turned positive. The momentum indicator (the Stochastic Oscillator ( SO )) is interesting. It has been showing very short term strength in the recent price action. The previous short rally quickly sent the SO into its positive zone. The reaction did not take it to new lows suggesting improvement in the internal strength of the price action. Now, the SO is just about to enter its positive zone again and is above its positive sloping trigger line. From this the very short term rating has further improved from last week and is now at a + NEUTRAL rating, one level below a full bullish rating.
SILVER
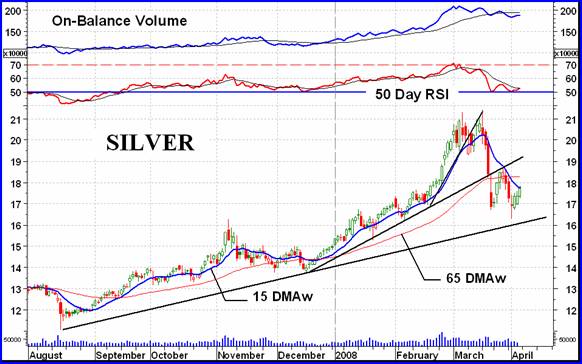
Once again silver has out performed gold, even though both closed the week lower. Silver lost 0.9% while gold lost 1.3%. The rally these past three days seems not to have the same strength as the rally a couple of weeks ago. This can be seen by the relatively weak momentum action. The volume indicator has also been showing a speculator interest that is underwhelming.
Although silver has gone through its three FAN trend lines with a cross below the third FAN trend line right near the top (as is quite the norm for this pattern) the third phase was quite short indicating that the reaction may also be quite short. It may even be over. The down move quickly broke the second FAN trend line, tried to rally and then dropped almost to the first line. That may be it for the downside move, but I would wait for confirmation of a trend reversal before assuming so. For now the indicators give me ratings of + NEUTRAL for the short term, - NEUTRAL for the intermediate term and BULLISH for the long term.
Merv's Precious Metals Indices
The Precious Metals Indices Table seems to show a difference of opinion between the Merv's Indices and the major North American Indices. The difference can be seen in the performance of one or two large gold stocks. They had a disproportionate influence on the calculation of the major Indices because of their size but did not have anywhere near the same effect in the Merv's Indices which does not take the size of the company into its calculation.
Based upon the 160 precious metal stocks in my Merv's Gold & Silver 160 Index universe the average price of a gold and silver stock declined by 1.5% during the week. Most of that decline was in the speculative stocks while the higher quality stocks gained 0.3%. With a minor weekly move the various Indices remained with the ratings they had last week, i.e. almost all in the NEG (or BEARISH) side. The most telling sign as to where the stocks are is in the summation of individual stock ratings for the various time periods. With the exception of a couple of NEUTRAL ratings all of the ratings for the various Merv's Indices are in the BEARISH camp, some quite bearish. Much more upside action would be required to turn these ratings around into the POS or BULLISH side.
Merv's Precious Metals Indices Table
Let's call it another week.
By Merv Burak, CMT
Hudson Aero/Systems Inc.
Technical Information Group
for Merv's Precious Metals Central
Web: www.themarkettraders.com
e-mail: merv@themarkettraders.com
Before you invest, Always check your market tirming with a Qualified Professional Market Technician
For DAILY Uranium stock commentary and WEEKLY Uranium market update check out my new Technically Uranium with Merv blog at www.techuranium.blogspot.com .
During the day Merv practices his engineering profession as a Consulting Aerospace Engineer. Once the sun goes down and night descends upon the earth Merv dons his other hat as a Chartered Market Technician ( CMT ) and tries to decipher what's going on in the securities markets. As an underground surveyor in the gold mines of Canada 's Northwest Territories in his youth, Merv has a soft spot for the gold industry and has developed several Gold Indices reflecting different aspects of the industry. As a basically lazy individual Merv's driving focus is to KEEP IT SIMPLE .
To find out more about Merv's various Gold Indices and component stocks, please visit www.themarkettraders.com and click on Merv's Precious Metals Central . There you will find samples of the Indices and their component stocks plus other publications of interest to gold investors. While at the themarkettraders.com web site please take the time to check out the Energy Central site and the various Merv's Energy Tables for the most comprehensive survey of energy stocks on the internet. Before you invest, Always check your market timing with a Qualified Professional Market Technician
Merv Burak Archive |
© 2005-2022 http://www.MarketOracle.co.uk - The Market Oracle is a FREE Daily Financial Markets Analysis & Forecasting online publication.