


A Generally Grim August For World Stock Markets
Stock-Markets / Global Stock Markets Sep 02, 2013 - 12:01 PM GMTBy: PhilStockWorld

 Courtesy of Doug Short. The past week was a generally bad week for my eight focus indexes with China’s Shanghai and India’s SENSEX as the only ones posting gains. (See the four-week tables below for the complete weekly listings). The Shanghai was the top performer with its 1.99% advance. The SENSEX was a distant second with a 0.54% gain. The two eurozone indexes fared the worst, with France’s CAC 40 down 3.33% and Germany’s DAXK down 3.73%.
 Since Friday was the last market day of August, we can also study the monthly comps for the eight indexes. The Shanghai was the only one to post a gain, and it was a substantial 5.25%. The second best performance was Hong Kong’s Hang Seng, which lost a mere 0.70%. A loss of 1.48% was enough for the French index to take the third spot. Two indexes lost fractionally more than two percent, and three indexes fell more than three percent, including the S&P 500, which posted its worst monthly close in 15 months.
Despite its strong August gain, the Shanghai Composite remains the only index on the watch list in bear territory — the traditional designation for a 20% decline from an interim high. See the table inset (lower right) in the chart below. The index is still down nearly 40% from its interim high of August 2009. At the other end, the S&P 500 traded places with Germany’s DAXK for the top spot, with France’s CAC 40 only one basis point behind the DAXK in third.
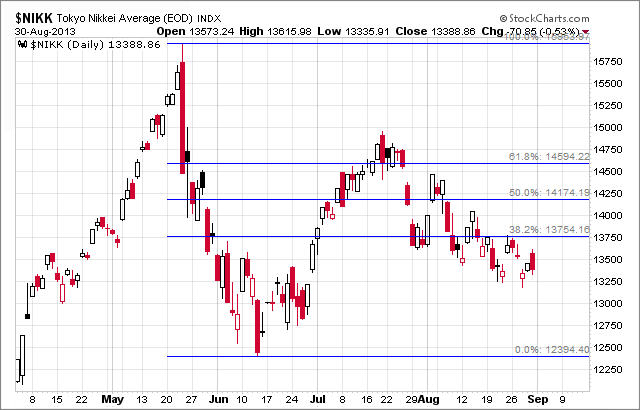
Here is a closer look at the YTD performances, with the volatile Nikkei as the ongoing attention-grabber.
For the past several weeks I’ve included a snapshot of the Nikkei with its Fibonacci retracement highlighted. The behavior of the index against this metric remains fascinating. Below is an update through Friday. For the past eleven sessiosn, the index has been stuck below the 38.2% lower Fib. Clearly this Fibonacci “jungle gym” continues to be a feature of the Abenomics playground.
 Here is a table highlighting the 2013 year-to-date gains, sorted in that order, along with the 2013 interim highs for the eight indexes. The strong performance of the Japan’s Nikkei, despite its big correction and subsequent volatility, puts it solidly in the top spot with a 28.80% YTD gain but well off its 2013 peak gain of 50.33%. Still, that’s about twice the YTD gain of the runner-up S&P 500. The indexes in the red are the same as last week.
A Closer Look at the Last Four Weeks
The tables below provide a concise overview of performance comparisons over the past four weeks for these eight major indexes. I’ve also included the average for each week so that we can evaluate the performance of a specific index relative to the overall mean and better understand weekly volatility. The colors for each index name help us visualize the comparative performance over time.
The chart below illustrates the comparative performance of World Markets since March 9, 2009. The start date is arbitrary: The S&P 500, CAC 40 and BSE SENSEX hit their lows on March 9th, the Nikkei 225 on March 10th, the DAX on March 6th, the FTSE on March 3rd, the Shanghai Composite on November 4, 2008, and the Hang Seng even earlier on October 27, 2008. However, by aligning on the same day and measuring the percent change, we get a better sense of the relative performance than if we align the lows.
A Longer Look Back
Here is the same chart starting from the turn of 21st century. The relative over-performance of the emerging markets (Shanghai, Mumbai SENSEX, Hang Seng) up to their 2007 peaks is evident, and the SENSEX remains by far the top performer. The Shanghai, in contrast, formed a perfect Eiffel Tower from late 2006 to late 2009.
Check back next week for a new update.
Note from dshort: I track Germany’s DAXK a price-only index, instead of the more familiar DAX index (which includes dividends), for constency with the other indexes, which do not include dividends.
- Phil
Philip R. Davis is a founder of Phil's Stock World (www.philstockworld.com), a stock and options trading site that teaches the art of options trading to newcomers and devises advanced strategies for expert traders. Mr. Davis is a serial entrepreneur, having founded software company Accu-Title, a real estate title insurance software solution, and is also the President of the Delphi Consulting Corp., an M&A consulting firm that helps large and small companies obtain funding and close deals. He was also the founder of Accu-Search, a property data corporation that was sold to DataTrace in 2004 and Personality Plus, a precursor to eHarmony.com. Phil was a former editor of a UMass/Amherst humor magazine and it shows in his writing -- which is filled with colorful commentary along with very specific ideas on stock option purchases (Phil rarely holds actual stocks). Visit: Phil's Stock World (www.philstockworld.com)
© 2013 Copyright PhilStockWorld - All Rights Reserved Disclaimer: The above is a matter of opinion provided for general information purposes only and is not intended as investment advice. Information and analysis above are derived from sources and utilising methods believed to be reliable, but we cannot accept responsibility for any losses you may incur as a result of this analysis. Individuals should consult with their personal financial advisors.
PhilStockWorld Archive |
© 2005-2022 http://www.MarketOracle.co.uk - The Market Oracle is a FREE Daily Financial Markets Analysis & Forecasting online publication.