


Gold And Silver Market Says 1 -2 Years Sideways, Not Up
Commodities / Gold and Silver 2013 Sep 01, 2013 - 05:18 PM GMTBy: Michael_Noonan

 Re 1 - 2 years of potentially moving sideways, we would be happy to be wrong.
In a week of no news relevant to gold and silver, gold slipped under the 1400 level, for some "unknown" reason, while silver just slipped a little. Friday marked the close of the week and month, for charting purposes. A look at the Quarterly, in progress, seemed a good idea, as well.
Almost everyone has an opinion on any given market, but especially for gold, with the exception of financial news networks which never have an opinion on gold, unless it is to point out how poorly it is doing. Opinions, however, do not move markets, only executed trades matter, a topic covered a few weeks ago, [Only Votes Cast In Elections Count, Same For Markets, http://bit.ly/15mjhKP, if you missed it.]
The only opinion that matters is what the market is saying about those who are actually participating, and that shows up as fact when viewed on the charts. Opinion, sentiment, belief, expectation, none lead the market but are more reflective of one's mindset, and in the end, it is the market that always has the last word. From our perspective, it is better to follow the market's lead.If you have a consistent game plan, profitable results will follow.
A shorter version of the above is simply, do not fight the tape!
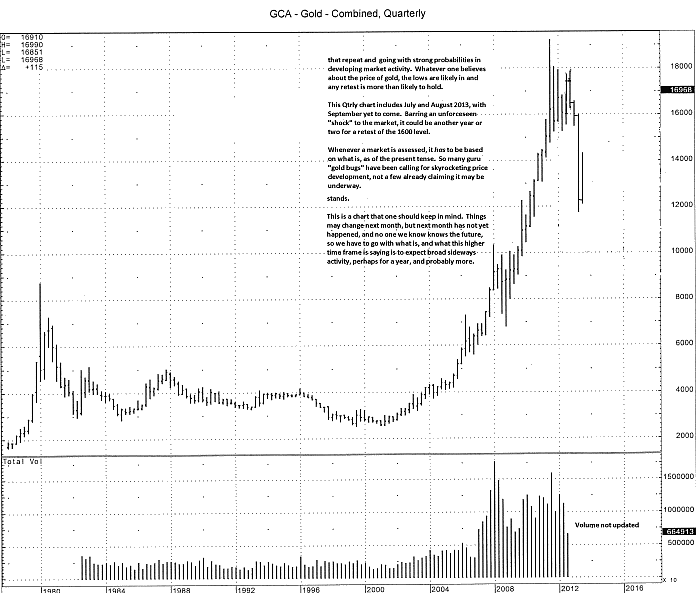
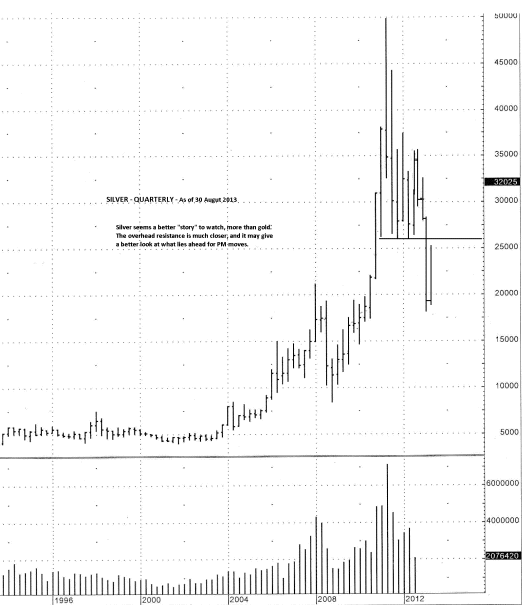
[We just saw that a part of the chart comments was cut off. It pertained to dealing with patterns that consistently repeat in behavior, and they act as a reliable guide for making trade decisions, re first paragraph on chart.]
Stand-out wide range bars tend to capture market behavior for the next several time periods, so for a Quarterly, it can be a few years. In the 2011 wide range bar, gold traded sideways for 6 more quarters, before being "driven" lower. The 2nd Q bar, second from the end, is almost equal in size to the range that formed the high. Using past history of how price responds, it is likely that gold, [and silver], will move sideways for another year or two. This flies in the face of so many current, mostly expert opinions.
As noted on the chart, only some highly unexpected news event could "shock" price out of normal pattern behavior, which is what it would take to get the price of gold and silver to move higher, in line with "expectations" of the PMs community. A collapse of the fiat Federal Reserve Note would be such a catalyst example. There is history for that kind of event, taken from the Federal Reserve's model, the Weimar Republic banking system from Germany, which ultimately went wildly amok from its infinite printing binge. Still, it took some time for it to unravel, as it is for today's criminal bankers gone wild.
Given that the New World Order's central bankers have a stronghold, literally, on the Western banking system, that power will not easily be ceded, and that faction will destroy currencies in the process before ever acknowledging their [historically proven to be] doomed policies are not working...except in transferring the Western world's wealth into their greedy hands. On that score, things are working beautifully, if you happen to be a part of the NWO.
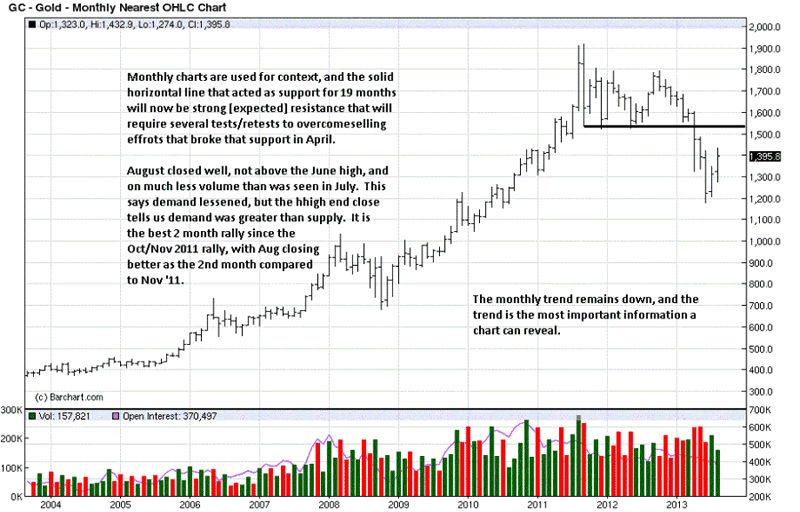
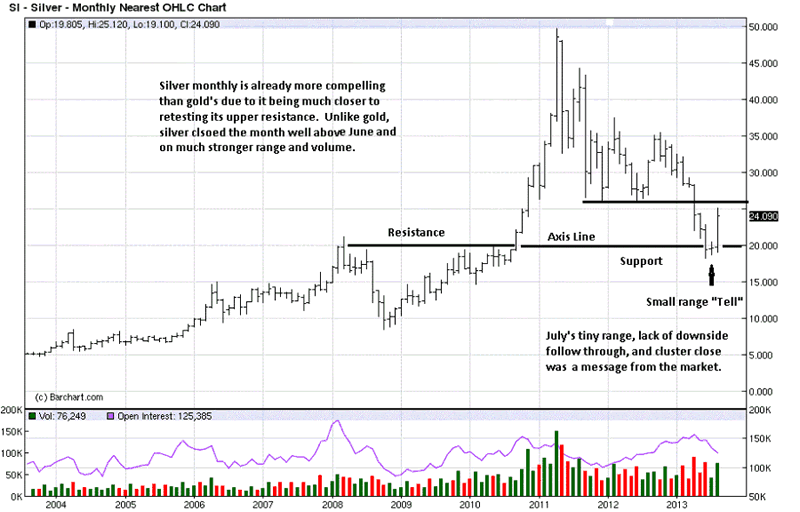
The two most important bars are April, 5 bars ago, and June, 3 bars ago. Both are wide range bars lower when JPMorgan made its [illegal] naked short selling takedown attempts to suppress that central banker nemesis. While relatively high, volume for June was the lowest of all 2013 months. It is the market's way of showing us that sellers were less in number. Even though June's close was weak, there was no further follow through to the downside. In fact, July and August just erased the central bank effort from June.
An August close over the June high would have been a more bullish statement, but it takes time to turn a trend, and these two higher time frames suggest it will take more time to get gold higher, as in above 1600.
It is most pertinent to let first impressions develop into more considered thought for they tend to be the most reliable. The upside rally in gold seems to be legitimate in viewing the activity as a possible bottom, but that needs more time to be confirmed. Once the weekly close posted on the lower end, it gave rise to expect the potential of additional downside. The two high volume bars from the end of May made their presence more clearly.
Volume shows the effort extended, and for these two weeks the effort was much higher than recent showings. It is the result that give importance to the effort. The result, after two weeks of buying, [higher closes], was opposite, and it was cued by the poor closings, especially on the higher volume 2nd of the two bars. Sellers were stronger, and it becomes so vividly apparent in understanding why last week failed to extend higher. It will take time for buyers to successfully absorb the effort of sellers primarily from the end of May.
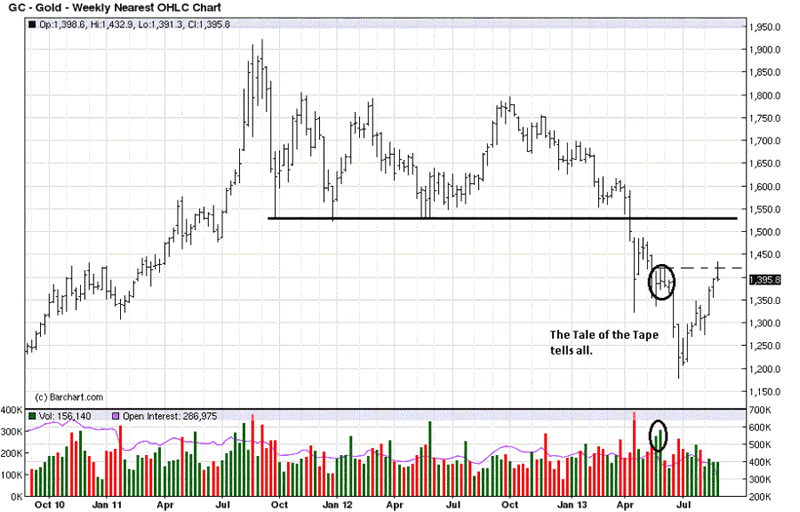
The higher time frames give color to reading the daily. The ability for gold to rally from recent lows has been positive. The more negative trend aspects from the higher time frames act as a reminder that it will take more time and effort to succeed in overcoming prevailing seller efforts.
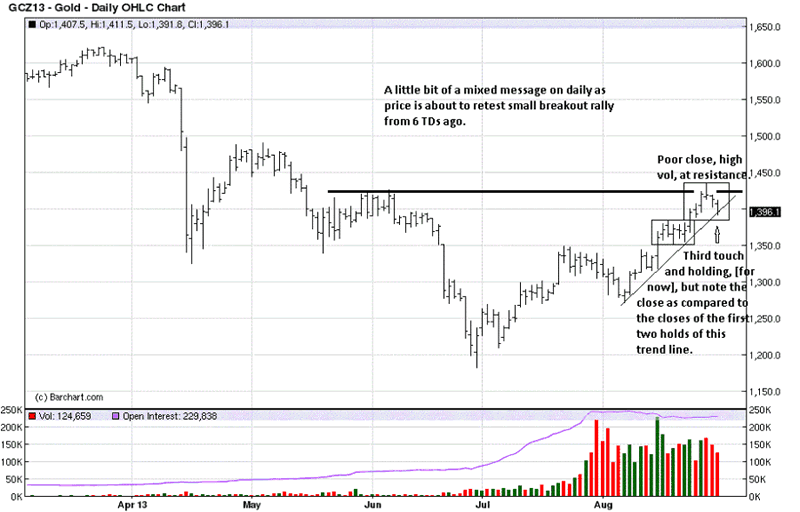
The message is presented as mixed due to the positive manner in which the market has unfolded since the end of June. Price continues to hold the up-sloping trend line, but the poor location of the close tells us its breach may occur, and that event would be a part of normal activity, even in an up trend. Yet, the lower box, just under last week, shows the potential for support that could buffer any possible decline.
The higher time frames are a reminder to be very select when approaching gold from the long side. We remain long.
Silver was identified in several previous commentaries as being closer to support than gold, while gold has an overall stronger chart. We continue to adhere to that notion.
Silver was also designated as more compelling than gold, even back in early July, [see: It Is Silver Sending A Message, click on http://bit.ly/10EW8FO]. Unlike gold, August's strong rally close not only obliterated June's high, it challenged May's high, at the same time. The so-called lesser metal is making a better showing, currently.
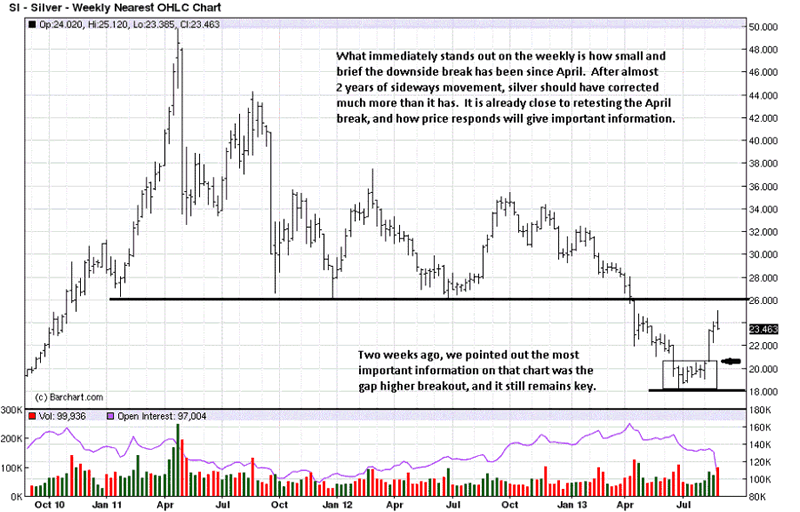
Observations lead to perceptions on what developing market activity may be signaling. Taking note of the protracted trading range, as everyone who follows gold and silver is keenly aware, a trading range formation is akin to a stored energy build-up from which price will more directionally. Here, price broke to the downside, but there has been very little further progress. In fact, the upside reaction from the lows has been impressive.
Last week's poor close may lead to more downside, but there are no signs of supply coming onto the market that will deter this currently developing rally.
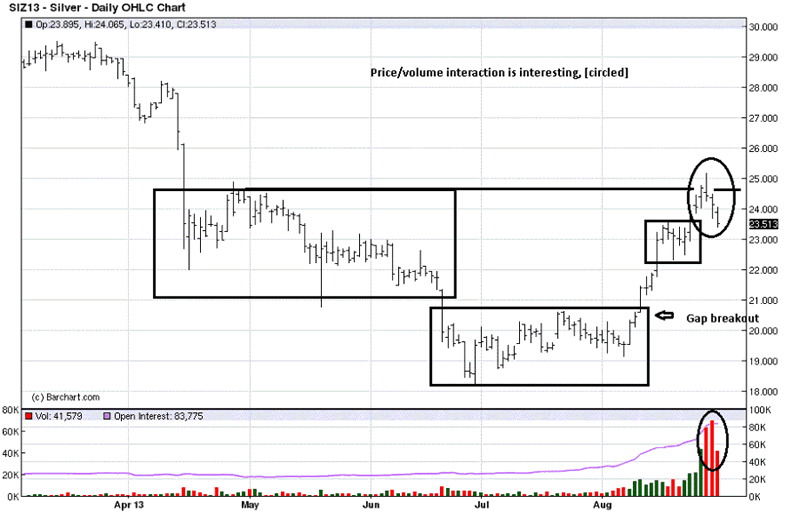
The highest volume occurred on Thursday, but the close was in the upper half of the bar. Actually, when reviewing the daily chart activity, we did not keep in mind the rollover from Sep into Dec, so that discussion is scratched.
Price did stop on high volume, irrespective of any rollover activity, and silver has retraced back to the previous box trading range, and that may act as a buffer against further declines.
One can attribute activity to the Syria situation, where the Nobel Peace Prize winner who is solely leading the charge to attack that nation, despite world-wide opinion coming to a different conclusion as to who was responsible for any purported chemical attack, but by simply following the developing market activity, forming outside "opinions" is not needed.
The where price stops and how, next week, will give additional information on how to be handling this market. We remain long.
By Michael Noonan
Michael Noonan, mn@edgetraderplus.com, is a Chicago-based trader with over 30 years in the business. His sole approach to analysis is derived from developing market pattern behavior, found in the form of Price, Volume, and Time, and it is generated from the best source possible, the market itself.
© 2013 Copyright Michael Noonan - All Rights Reserved Disclaimer: The above is a matter of opinion provided for general information purposes only and is not intended as investment advice. Information and analysis above are derived from sources and utilising methods believed to be reliable, but we cannot accept responsibility for any losses you may incur as a result of this analysis. Individuals should consult with their personal financial advisors.
Michael Noonan Archive |
© 2005-2022 http://www.MarketOracle.co.uk - The Market Oracle is a FREE Daily Financial Markets Analysis & Forecasting online publication.