


Elliott Wave on Gold and Silver Retracements
Commodities / Gold & Silver Apr 03, 2008 - 08:02 AM GMTBy: Dan_Stinson
 Short Term Forecast
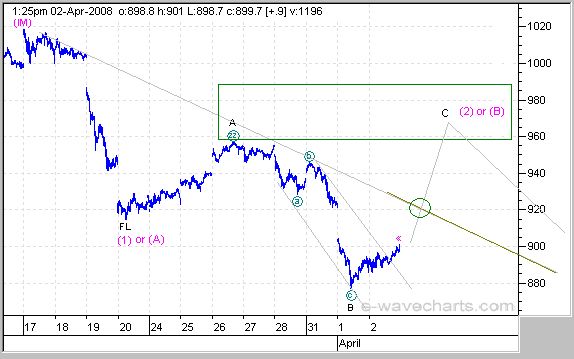
The price action for Gold and Silver appears to be in a wave (2) or wave (B) correction. We should see the price of Gold and Silver advance to the recent highs attained on Mar 26th 2008. This wave up will also confirm if the intermediate highs are in place for the metals.
A failure to move above the wave (2) or wave (B) target areas would indicate further downside and that a larger correction is in play. A move above the target areas would suggest further upside towards the highs. A failure to attain the target areas would indicate that a smaller wave 2 correction is in play and further downside would be expected. We have discussed a few scenarios, but we are expecting at least an advance to the Mar 26th price area.
Gold
Silver
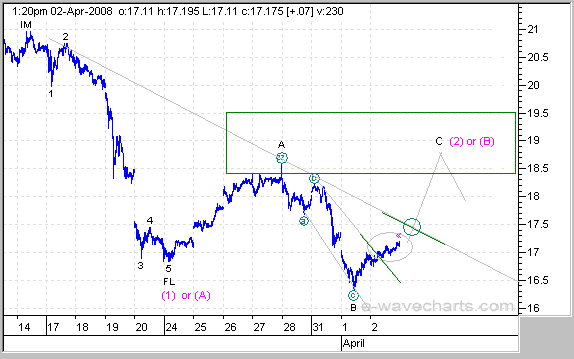
We need to see the price action break above the upper trendline to support the rise into the wave C target area. A failure to break above this line would indicate that a smaller wave 2 rally is in play.
These charts are only a guide so that you can follow the action and watch for the expected action in the the wave (2) or wave (B) target area. The action could play out exactly as illustrated or it may need minor adjustments as we follow it through.
If you are interested in viewing these updated charts and other detailed charts with targets on a daily basis, please see the registration details below.
Elliott Wave Chart Site - IntraDay Market Updates on the DOW, Nasdaq, S&P500, Gold, Silver, HUI and the USD.
By Dan Stinson
http://www.e-wavecharts.com
Copyright© 2001-2008
The indices covered include the NASDAQ, DOW, S&P 500, Nikkei, and DOW Transports. Commodity charts include the CRB Index, Copper, Crude, Gold, Silver, HUI and the XAU (Gold and Silver index) . Additional Elliott Wave charts cover the US Dollar (USD),CAD, Euro, 10 Year Treasury Note Yield (TNX), Nortel, Ballard Power, EBay, Encana (ECA), North American Palladium, Gold Corp, Pan American Silver, Central Fund (CEF), Couer D Alene Mines (CDE), Newmont Mining (NEM), Agnico Eagle Mines (AEM) and Denison Mines.
© 2005-2022 http://www.MarketOracle.co.uk - The Market Oracle is a FREE Daily Financial Markets Analysis & Forecasting online publication.