Most Popular
1. Banking Crisis is Stocks Bull Market Buying Opportunity - Nadeem_Walayat
2.The Crypto Signal for the Precious Metals Market - P_Radomski_CFA
3. One Possible Outcome to a New World Order - Raymond_Matison
4.Nvidia Blow Off Top - Flying High like the Phoenix too Close to the Sun - Nadeem_Walayat
5. Apple AAPL Stock Trend and Earnings Analysis - Nadeem_Walayat
6.AI, Stocks, and Gold Stocks – Connected After All - P_Radomski_CFA
7.Stock Market CHEAT SHEET - - Nadeem_Walayat
8.US Debt Ceiling Crisis Smoke and Mirrors Circus - Nadeem_Walayat
9.Silver Price May Explode - Avi_Gilburt
10.More US Banks Could Collapse -- A Lot More- EWI
Last 7 days
Stock Market Volatility (VIX) - 25th Mar 24
Stock Market Investor Sentiment - 25th Mar 24
The Federal Reserve Didn't Do Anything But It Had Plenty to Say - 25th Mar 24
Stock Market Breadth - 24th Mar 24
Stock Market Margin Debt Indicator - 24th Mar 24
It’s Easy to Scream Stocks Bubble! - 24th Mar 24
Stocks: What to Make of All This Insider Selling- 24th Mar 24
Money Supply Continues To Fall, Economy Worsens – Investors Don’t Care - 24th Mar 24
Get an Edge in the Crypto Market with Order Flow - 24th Mar 24
US Presidential Election Cycle and Recessions - 18th Mar 24
US Recession Already Happened in 2022! - 18th Mar 24
AI can now remember everything you say - 18th Mar 24
Bitcoin Crypto Mania 2024 - MicroStrategy MSTR Blow off Top! - 14th Mar 24
Bitcoin Gravy Train Trend Forecast 2024 - 11th Mar 24
Gold and the Long-Term Inflation Cycle - 11th Mar 24
Fed’s Next Intertest Rate Move might not align with popular consensus - 11th Mar 24
Two Reasons The Fed Manipulates Interest Rates - 11th Mar 24
US Dollar Trend 2024 - 9th Mar 2024
The Bond Trade and Interest Rates - 9th Mar 2024
Investors Don’t Believe the Gold Rally, Still Prefer General Stocks - 9th Mar 2024
Paper Gold Vs. Real Gold: It's Important to Know the Difference - 9th Mar 2024
Stocks: What This "Record Extreme" Indicator May Be Signaling - 9th Mar 2024
My 3 Favorite Trade Setups - Elliott Wave Course - 9th Mar 2024
Bitcoin Crypto Bubble Mania! - 4th Mar 2024
US Interest Rates - When WIll the Fed Pivot - 1st Mar 2024
S&P Stock Market Real Earnings Yield - 29th Feb 2024
US Unemployment is a Fake Statistic - 29th Feb 2024
U.S. financial market’s “Weimar phase” impact to your fiat and digital assets - 29th Feb 2024
What a Breakdown in Silver Mining Stocks! What an Opportunity! - 29th Feb 2024
Why AI will Soon become SA - Synthetic Intelligence - The Machine Learning Megatrend - 29th Feb 2024
Keep Calm and Carry on Buying Quantum AI Tech Stocks - 19th Feb 24

Market Oracle FREE Newsletter

How to Protect your Wealth by Investing in AI Tech Stocks

The Most Important Gold Charts

Commodities / Gold and Silver 2013 Aug 08, 2013 - 11:19 AM GMT

By: Peter_Degraaf

Commodities

The two most important charts you’re likely to see all day.


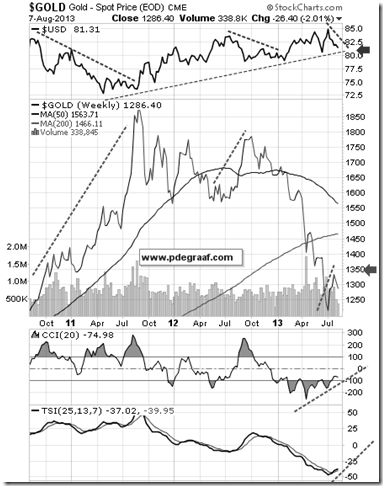
Featured is the weekly gold chart, with the US dollar at the top. The rising dotted lines in the gold chart coincide with falling dotted lines in the US dollar index chart. The long uptrend line supporting the dollar coincides with the latest correction in the gold price. The arrow in the dollar chart points to a possible breakdown below the rising trend-line in the dollar (once price drops below the arrow). In the event that this occurs, it is very likely to coincide with the gold price rising above the arrow in the gold chart. The supporting indicators at the bottom of the chart are turning positive. (Chart courtesy Stockcharts.com)


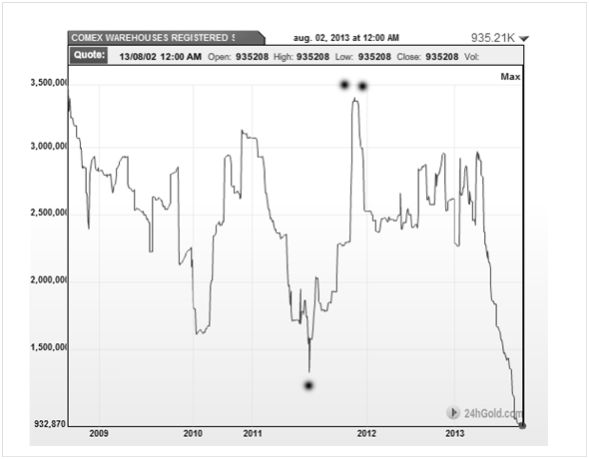
This chart courtesy 24hgold.com shows the amount of gold bullion at the COMEX that is registered and available for delivery, currently 935,000 ounces - the lowest amount in at least five years. Notice how the previous low in this chart in mid- 2011 (single dot), coincided with the gold price bottoming at $1500 and subsequently rising to $1915. The high point in this chart at the end of 2011 (two dots), coincided with the gold price topping out at $1915. “History does not always repeat, but it often rhymes"..Mark Twain.

Happy trading!

By Peter Degraaf

Peter Degraaf is an on-line stock trader with over 50 years of investing experience. He issues a weekend report on the markets for his many subscribers. For a sample issue send him an E-mail at itiswell@cogeco.net , or visit his website at www.pdegraaf.com where you will find many long-term charts, as well as an interesting collection of Worthwhile Quotes that make for fascinating reading.

© 2013 Copyright Peter Degraaf - All Rights Reserved

DISCLAIMER:Please do your own due diligence.  Investing involves taking risks.  I am not responsible for your investment decisions.

Peter Degraaf Archive

© 2005-2022 http://www.MarketOracle.co.uk - The Market Oracle is a FREE Daily Financial Markets Analysis & Forecasting online publication.


Post Comment

Only logged in users are allowed to post comments. Register/ Log in