


Is The Financial Crisis Over For Financial, Banking Stocks?
Companies / Banking Stocks Aug 03, 2013 - 12:39 PM GMT

 The cause of the financial crisis of 2007 -2008, also known as the Great Recession of 2008, is attributed to many different theories. However, one of the most common theories is an easy money regulatory environment that led to an abundance of subprime loans, which in turn inflated real estate prices to bubble levels. Additionally, many blame the Financial sector, predominantly the money center banks, for exploiting the lax lending requirements with reckless and greedy behavior. They did this through the creation of and proliferation of high risk bundled subprime mortgages (CMO’s, etc.) and the creation of other high risk and complex financial products that were being pawned off as safe investments.
Additionally, many attribute the repeal of the Glass-Steagall Act in 1999 as a major contributor to the financial crisis, which effectively removed the separation between investment banks and depository banks in the United States. There was plenty of blame to go around, which included avarice, greed and excesses on Wall Street, and the failure of regulators to include many of the most prominent credit rating agencies.
Nevertheless, it is quite clear that the worst financial crisis since the Great Depression of the 1930s was due in great part to the greedy and reckless behavior on the part of various entities and institutions comprising the Financial sector. The businesses of most money center banks, many major insurance companies, and credit rating agencies were devastated as a result. Of course, the damage also temporarily ravaged the entire stock market, affecting businesses in all sectors because America’s financial system was literally fractured and frozen. The result was the Great Recession of 2008, which also spread its economic destruction on a global scale.
However, it is not my intention to debate these issues, instead, my objective with this article is to review the current state of dividend paying stocks within the Financial sector as I try to determine whether there’s currently value here or not. But before I do that, I thought it might be interesting to see in graphic form, just how badly some of our most prestigious financial institutions were affected. The following Earnings and Price Correlated F.A.S.T. Graphs™ on two prominent banks instantly illustrate what it would take thousands of words to convey.
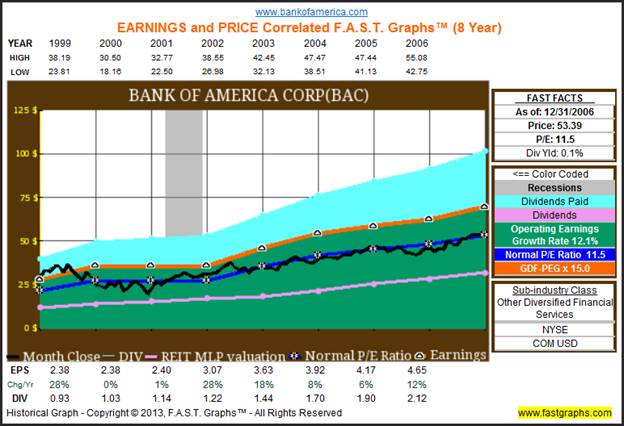
Bank of America Corp - 1999 to 2006
The following graph looks at Bank of America (BAC) from calendar year 1999 to calendar year 2006, which was the time period starting from the repeal of the Glass-Steagall Act to just prior to the bursting of the US housing bubble. These were the earnings growth golden years for large financial institutions in the United States. Earnings per share for Bank of America grew from $1.53 to $4.65 by year-end 2006 (look at the EPS line at the bottom of the graph). This represented a 12.1% compound annual growth rate of operating earnings per share for Bank of America.
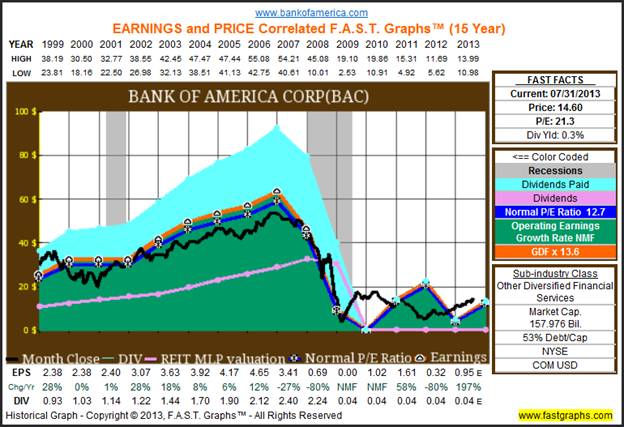
However, the next graph illustrates the punishment that excess, fear and greed created, deserved and resulted in. Earnings per share fell like an avalanche on a mountaintop from $4.65 at year-end 2006 to losses (the orange line on the graph). Of course, since earnings drive market prices and dividend income, both followed suit in rather breathtaking fashion. After peaking at over $55 a share in 2006, Bank of America’s stock price bottomed out at $2.53 by the spring of 2009. That’s approximately a 95% drop in shareholder value. Dividend income fell in tandem from a high of $2.40 per share in 2007 to only four cents a share by 2008. That represents a 98% dividend cut. These were devastating results for retirees depending on their Bank of America dividends.
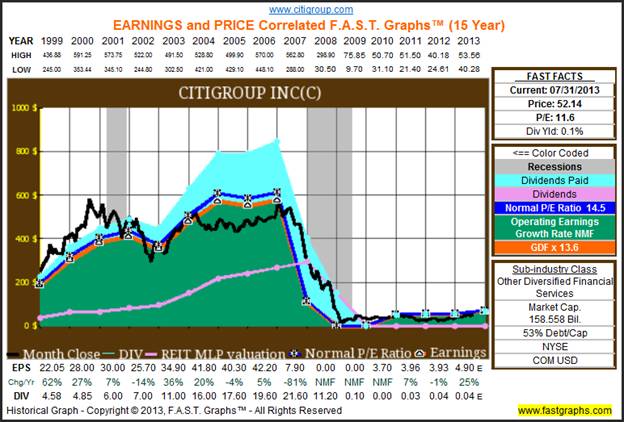
Just for validation purposes, I have also included an earnings and price correlated graph on Citigroup Inc (C). Instead of boring the reader with going over the numbers again, I will allow the graphic to speak for itself. However, it’s important to recognize that both of these prestigious bedrock’s of the Financial sector have continued to reel from their reckless behavior. Although both graphs, Bank of America and Citigroup, show that there has been a modest amount of recovery since, the crisis is far from over for these storied financial institutions.
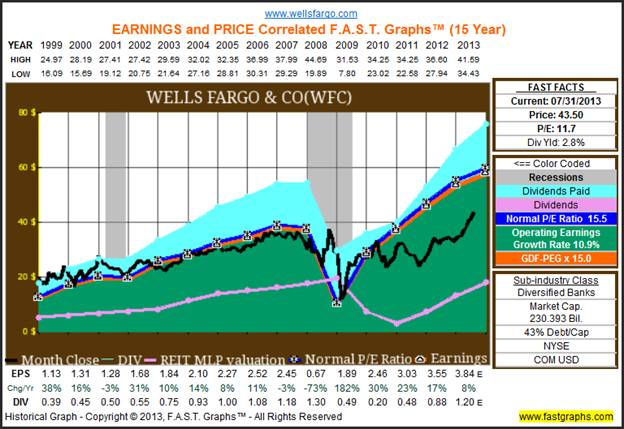
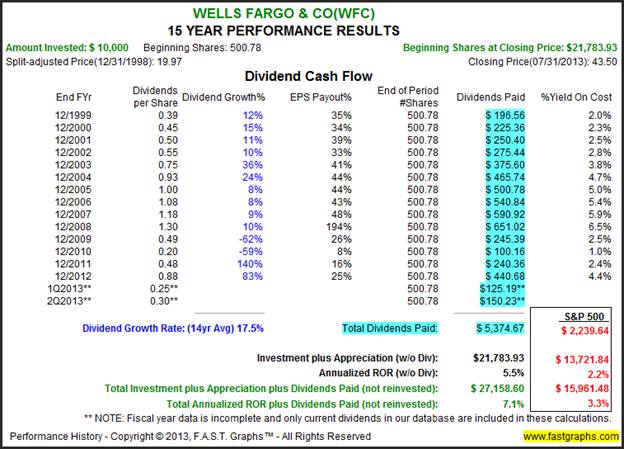
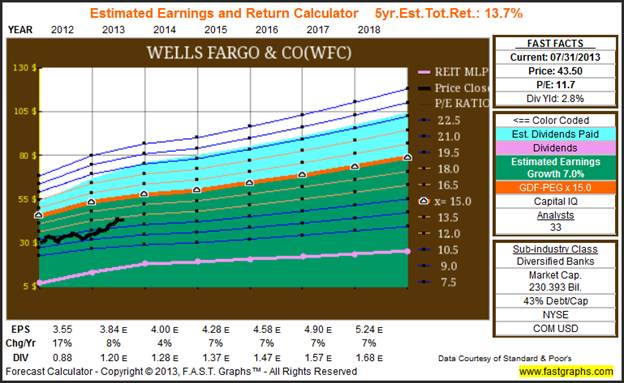
Next, and in the spirit of presenting a balanced view, I submit a Warren Buffett favorite, Wells Fargo & Company (WFC). Clearly, Wells Fargo suffered similar, but much less severe damage from the financial crisis. Even though it wasn’t quite as bad as what we saw with Bank of America and Citigroup, it is quite clear that Wells Fargo must have also participated in the easy money opportunities created by a lax regulatory lending environment. On the other hand, their recovery has been much stronger than my two previous examples. Nevertheless, long-term shareholders suffered significant, albeit temporary, price erosion and dividend cuts.
Although it may not be much solace to the diehard dividend growth investor, both Wells Fargo’s stock price and dividend income have moved back into historically normal levels. As you will see later in this article, I have included Wells Fargo in my conservative list of potential dividend growth stocks within the Financial sector. However, it’s up to the individual whether they would be willing to forgive this company for its past transgressions, or not.
The Financial Sector
This is the eighth in a series of articles designed to find value in today's stock market environment. However, it is the seventh of 10 articles covering the 10 major general sectors. In my first article, I laid the foundation that represents the two primary underlying ideas supporting the need to publish such a treatise. First and foremost, that it is not a stock market; rather it is a market of stocks. Second, that regardless of the level of the general market, there will always be overvalued, undervalued and fairly valued individual stocks to be found.
My first article was titled "Searching For Value Sector By Sector," my second article was titled "Finding Great Value In The Energy Sector." My third article was titled "Finding Value In The Materials Sector Is A Material Thing." My fourth article was titled "The Industrial Sector Offers A Lot Of Value, Dividend Growth And Income." My fifth article was titled Beware The Valuations On The Best Consumer Discretionary Dividend Growth Stocks, and my sixth article was titled, Are Blue-Chip Consumer Staples Worth Today's Premium Valuations?, and my seventh article For A Healthier Portfolio - Look Here.
As a refresher, my focus in this and all subsequent articles will be on identifying fairly valued dividend growth stocks within each of the 10 general sectors that can be utilized to fund and support retirement portfolios. Therefore, when I am finished, the individual investor interested in designing their own retirement portfolio should find an ample number of selections to properly diversify a dividend growth portfolio with.
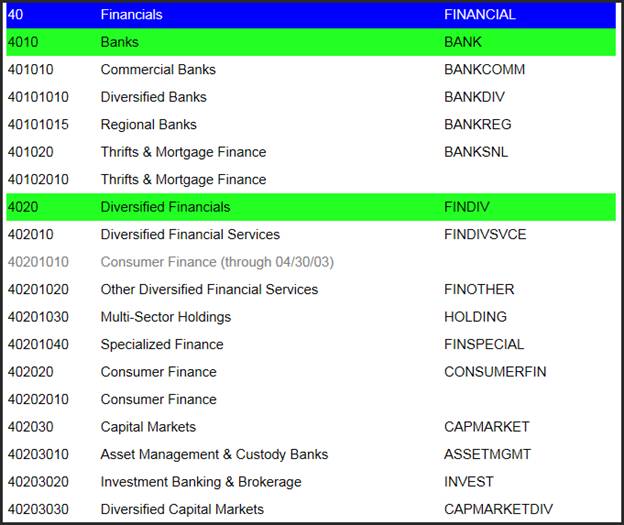
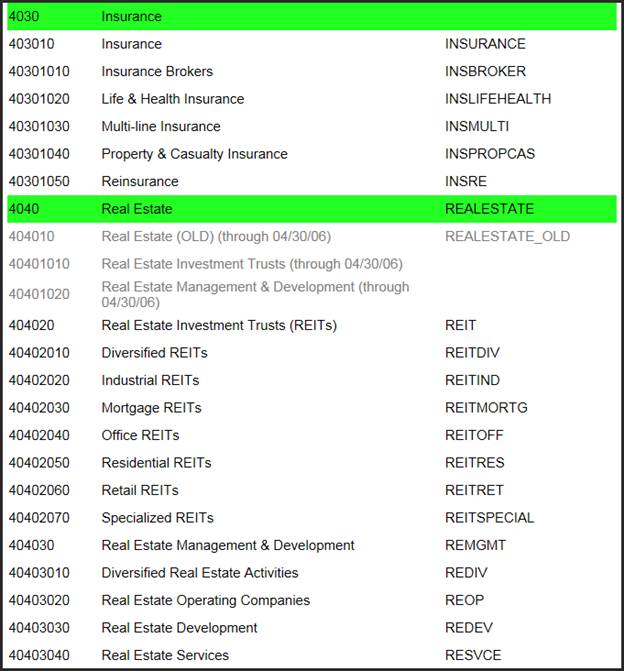
This article will look for undervalued and fairly valued individual companies within the general sector 40-Financials. Within this general sector, there are several subsectors, which I list as follows:
Screening the Financial Sector Universe
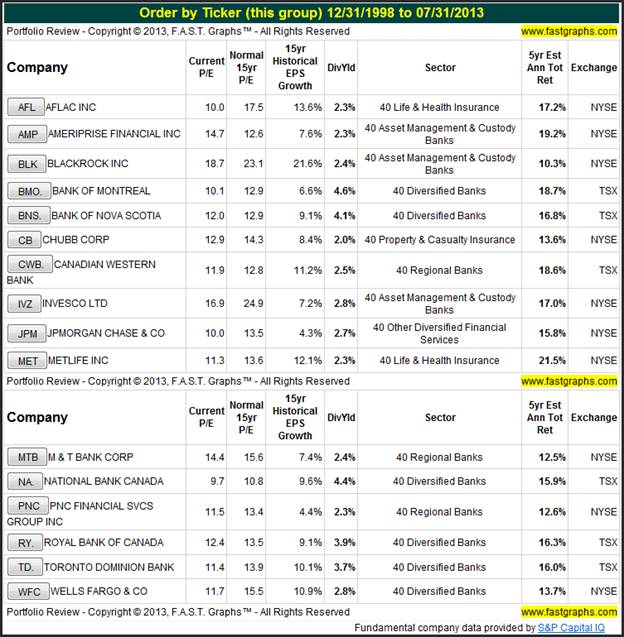
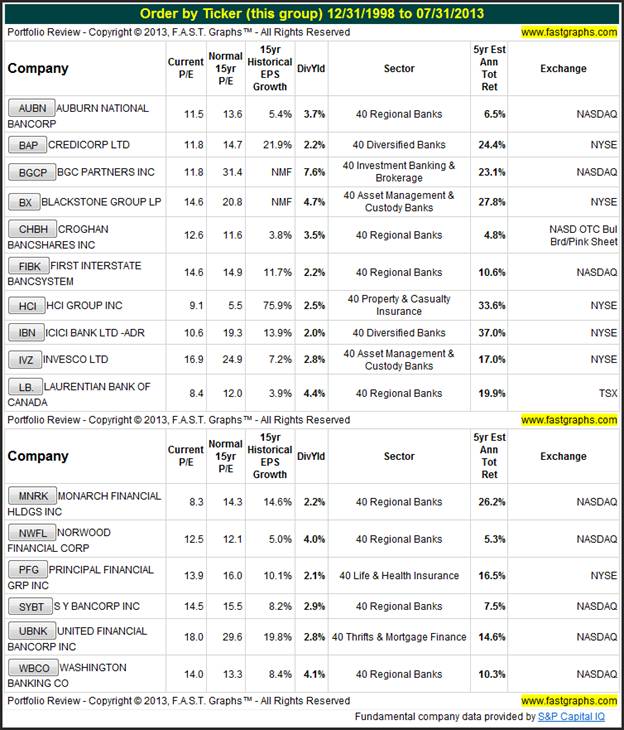
The following screenshot shows that I initially produced a list of 318 takers in the financial sector that paid a dividend. As I have done in all previous articles, I went through each of these 318 selections one company at a time utilizing the earnings and price correlated F.A.S.T. Graphs™ research tool. Much to my chagrin, I was only able to come up with 16 companies on my conservative list, and only another 16 companies that I was willing to include in my aggressive list:
![]()
Conservative Financials
As I looked for candidates in the Financial Sector that I felt were worthy of further scrutiny, I received quite an education on this sector. Not only is this industry very diverse, I was disappointed by how few opportunities I was able to find that fit my personal criteria. When looking for investment opportunities, I covet consistency and above-average growth. But even more importantly, I insist on sound valuation.
The following group of companies either met my criteria, or was very close to meeting it. Furthermore, since my screen included Canadian exchanges, the reader will discover a predominance of Canadian banks on the list. Since Canada did not participate in the lax lending practices, Canadian banks fared much better through the Great Recession of 2008 than most of their US counterparts did. Later I will feature the Bank of Nova Scotia (BNS.) as an example.
Aflac Inc. (AFL)
Not only is Aflac my featured company from the conservative selection, it is also my favorite company in the Financial sector, and has been for some time (For full disclosure, I have been long Aflac since January 2005). Since I have a long experience with Aflac, the reader should also assume that I have conducted comprehensive research on this name. Consequently, in addition to featuring it in this article, I also consider it a sound and attractive long-term investment.
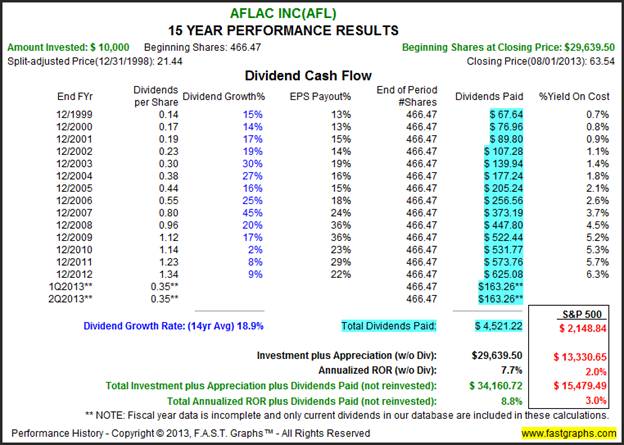
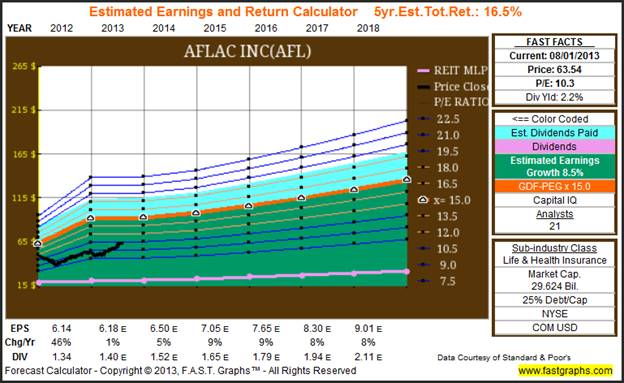
Furthermore, I believe that Aflac is currently undervalued with a blended P/E ratio of 10.3, and a current dividend yield of 2.2%. I might also point out that prior to the Great Recession of 2008 Aflac had generated a very consistent record of earnings growth. However, as a result of the Great Recession, Aflac took several actions, including the de-risking their portfolio, which added some cyclicality to their earnings record. Nevertheless, earnings growth has continued at an above-average rate. Moreover, during the Great Recession-induced cyclicality of their earnings, their dividend has continued to grow at an average rate of 16.8% since the beginning of 2007. However, their dividend growth rate has slowed to between 6% and 9% over the last 3 to 4 years.
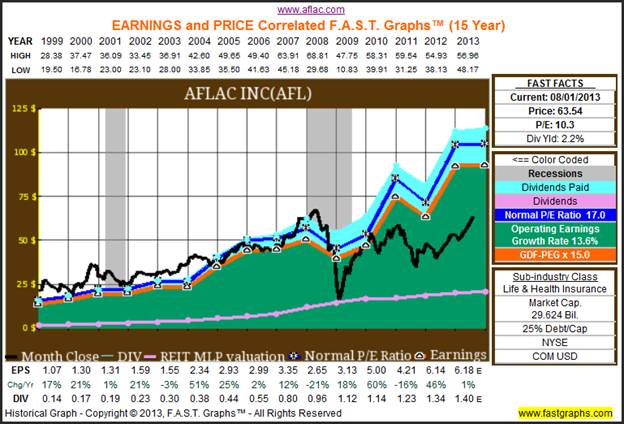
The long-term performance associated with the above Earnings and Price Correlated F.A.S.T. Graphs™ on Aflac demonstrates that in spite of its current low valuation, their strong operating history has rewarded shareholders in excess of the S&P 500 on all levels, capital appreciation and cumulative dividend income. Additionally, Aflac is a Dividend Champion and has increased their dividend for 30 consecutive years.
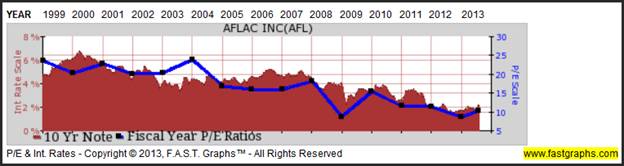
This next graphic looks at Aflac’s year-end price earnings ratios since 1999 (the blue line with black squares) overlaid with 10-year Treasury bond interest rates (the red shaded area). The important takeaway here is that Aflac’s P/E ratio has been in steady decline and even closely correlated to the drop in the interest rate of the 10-year Treasury.
This is counterintuitive, because in theory, the P/E ratios of common stocks should expand as interest rates decline, on the concept that bonds become less competitive to stocks when the interest rate they offer declines. I believe this simply reflects a negative bias towards equities, especially equities in the Financial sector, on the part of investors who were traumatized by the Great Recession of 2008.
The following Estimated Earnings and Return Calculator shows that 21 analysts reporting to Standard & Poor’s Capital IQ estimate Aflac to continue growing earnings at the rate of 8.5% per annum over the next 5 years. However, there are 2 additional estimates on this graph. Earnings growth for fiscal 2013 is only expected to average 1%, and growth for fiscal 2014 is estimated at 5%. I believe this partially explains the low valuation that “Mr. Market” is applying to Aflac shares currently. However, longer run I believe the patient dividend growth investor will be well-rewarded by investing in Aflac on a total return basis.
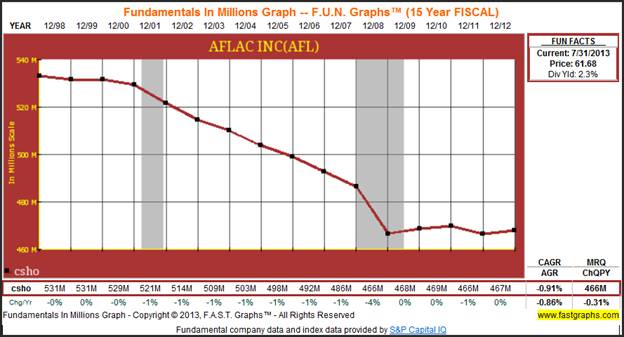
In addition to rewarding their shareholders through dividend increases and capital appreciation, Aflac has also been using its prodigious cash flows to purchase shares and reduce share count. Fewer shares outstanding support their ability to grow earnings per share to the benefit of shareholders. Common shares outstanding have fallen from 531 million shares in fiscal 1998 to 466 million shares in their most recent quarter (MRQ).
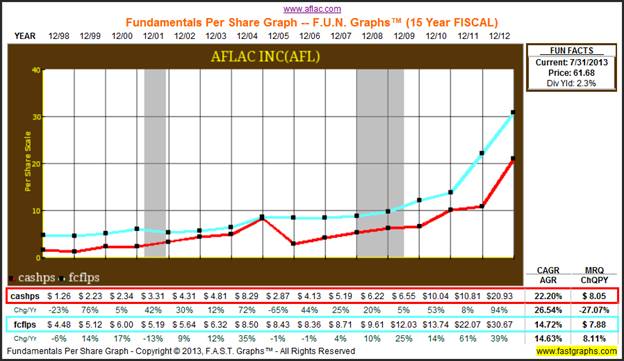
Additional insights into the financial strength of Aflac can be seen by reviewing their free cash flow per share, the light blue line on the FUN Graph below (Fundamental Underlying Numbers). Free cash flow per share (fcflps) has grown from $1.26 per share in 1998 to $30.67 a share by fiscal year-end 2012. This metric supports Aflac’s ability to pay dividends, as it is calculated after dividends have been paid.
In addition to being a prodigious generator of cash flow, Aflac has also accumulated $20.93 of cash and equivalents per share (cashps). I believe these important fundamental metrics indicate that Aflac is a financially strong and healthy company.
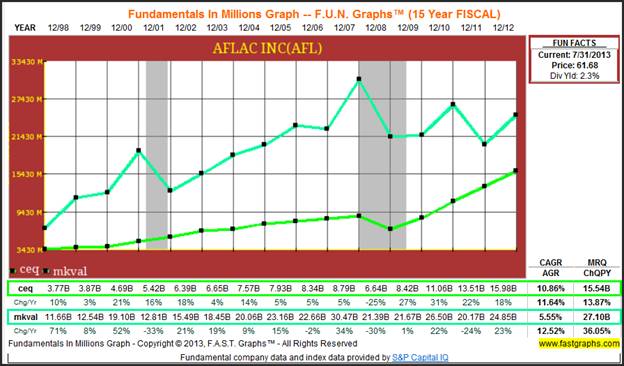
Additional strengths supporting Aflac’s business model can be found by reviewing their common equity or book value (ceq), the lime green line on the following graph, in comparison to their current market value (mkval), the aqua colored more jagged line on the graph. Aflac’s book value has increased steadily except for a minor pause during the Great Recession of 2008. In contrast, their market value has been much more cyclical and erratic. I believe this additionally reflects current undervaluation of Aflac’s shares. This further supports my contention that Aflac is a great business that is currently on sale.
Blackrock Inc. (BLK)
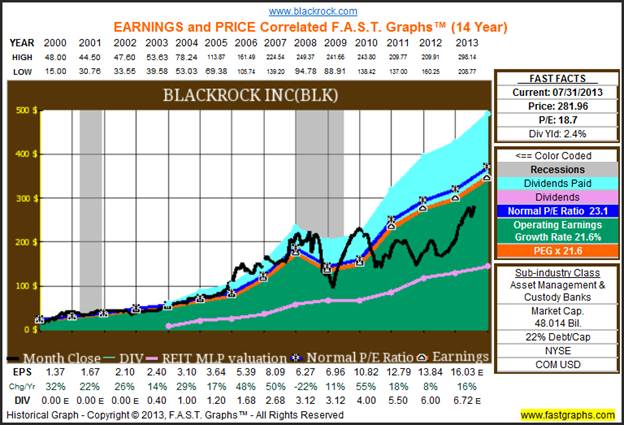
Blackrock Inc is the world’s largest asset manager serving individuals and institutions from all over the world. Since calendar year 2000 Blackrock has achieved a superior record of earnings growth averaging 21.6% per annum. Since earnings drive market price in the long run, their stock price has followed suit.
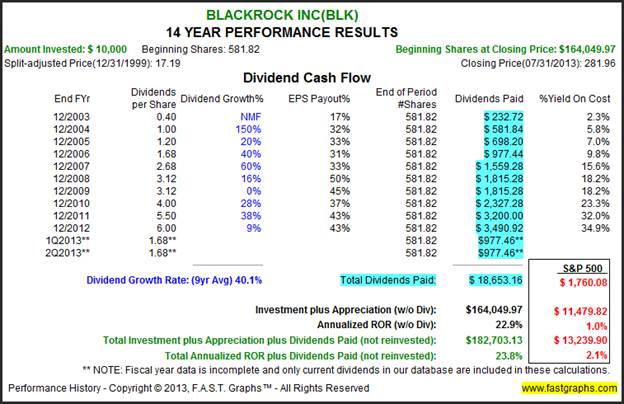
A $10,000 investment on December 31, 1999 would have grown to $164,049.97 by July 31, 2013. This represents a compound annual rate of return of 22.9% in contrast to only a 1% compounded annual rate of return for the S&P 500 over the same time. Additionally, Blackrock initiated a dividend in 2003 which has grown at a compounded annual rate of 40.1% per annum. Consequently, that same $10,000 investment on December 31, 1999 which generated dividends of $18,653.16, is more than 10 times the cumulative dividends of $1,760.08 for an equal investment in the S&P 500. This brings Blackrock’s total return to shareholders since 1999 to 23.8% per annum.
I offer Blackrock Inc as an exciting long-term opportunity in the Financial sector. However, I want to point out that I believe the company is fully valued at current levels. To be clear, I do not see it as being extremely overvalued, but I consider it fully valued as the price sits atop the valuation corridor depicted by the 5 orange lines on the Estimated Earnings and Return Calculator. However, the current estimates for future earnings growth might be biased based on what the company has accomplished since 2008 as it went through the Great Recession. As an aside, I calculated Blackrock’s earnings growth since 2008 and it has averaged 12.1% per annum, which closely correlates to the current estimates of 12.7%.
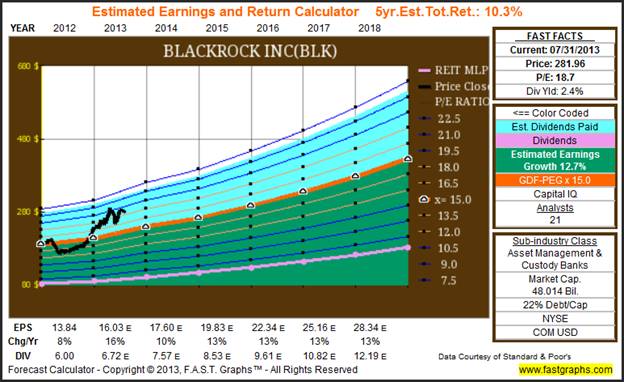
The important point I’m trying to convey here, is that valuation is rarely an exercise in precision. Instead, the best that an investor can hope to accomplish is to make decisions based on a reasonable range of probabilities and possibilities. In the case of Blackrock Inc, their long-term historical growth rate of 21.6% per annum would indicate that the company is currently undervalued on that basis.
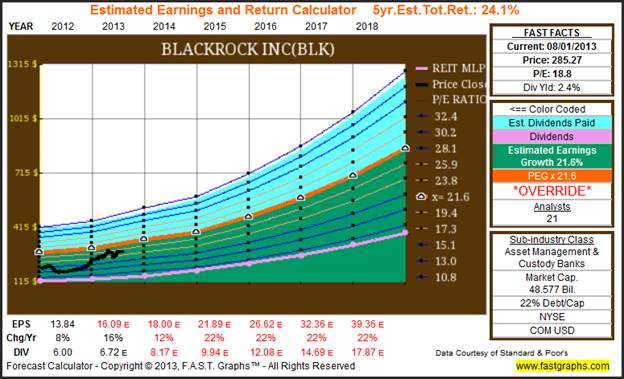
Therefore, if I utilized the override feature of the Estimated Earnings and Return Calculator and input the longer-term 21.6% earnings growth rate that Blackrock Inc has achieved, then the shares would appear undervalued on that basis. Although I believe the truth is somewhere in between current estimates and their long-term average, I would still suggest patiently waiting for a pullback before initiating a position. But with that said, I think this is a stock that should be on every dividend growth investor’s radar screen.
Bank of Nova Scotia (BNS.)
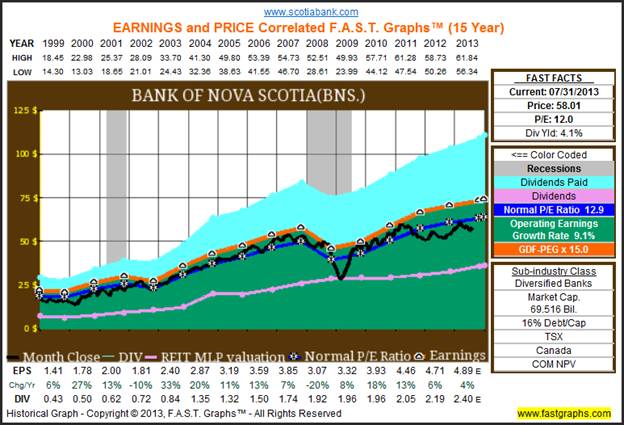
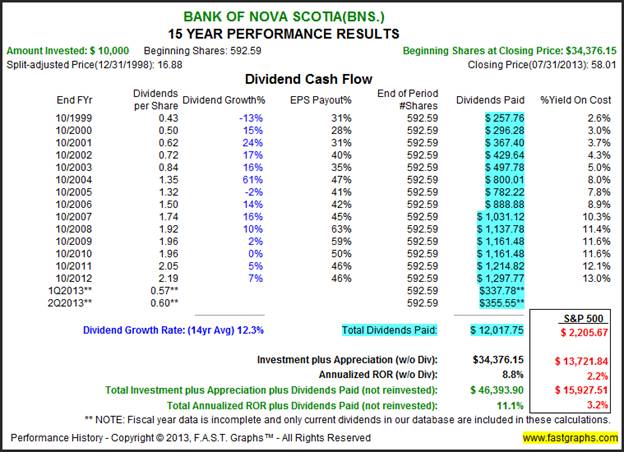
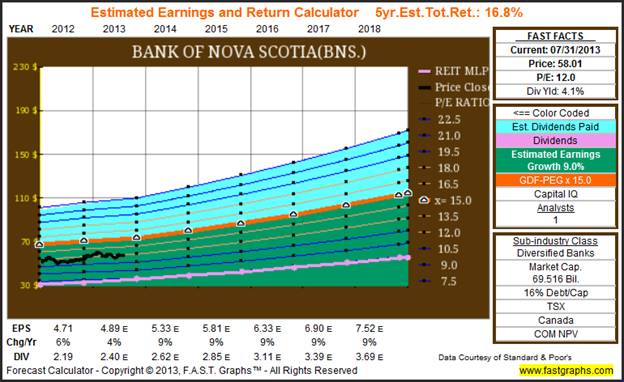
Since I included Canadian stock exchange companies in my screen, I thought it would be appropriate to feature a Canadian bank. As I previously stated, Canadian financial institutions were not participating in the greedy behavior of their US counterparts which created the financial crisis in the United States. Consequently, for those dividend growth investors desirous of adding a financial institution, there are many Canadian banks that look very attractive on a valuation and current yield basis. The Bank of Nova Scotia is but one example, there are several others that made the conservative list above.
To avoid a lot of excess rhetoric, I will simply let the following F.A.S.T. Graphs™ speak for themselves. As the graphs depict, the Bank of Nova Scotia has an excellent long-term track record, a very attractive current dividend yield and appears to be very attractively valued at current levels. Of course, and as always, further due diligence is suggested.
Aggressive Financials
The following portfolio review lists several more aggressive financial companies that I felt worthy of further due diligence. Once again, I am not specifically recommending any of these selections as current buys. Instead, I offer these as potential candidates that appear worthy of a more comprehensive due diligence effort.
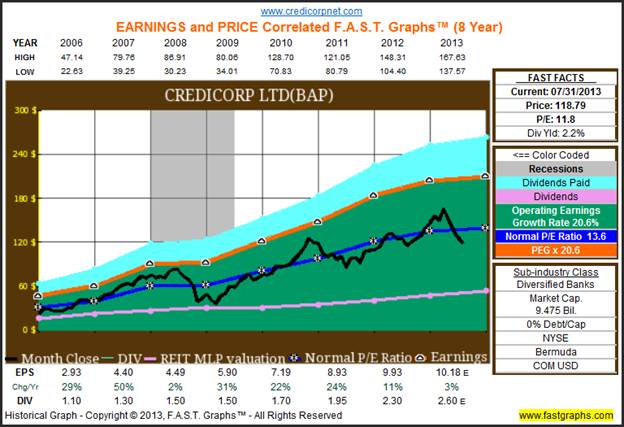
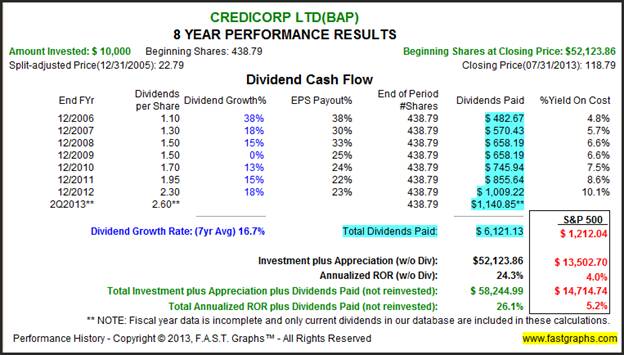
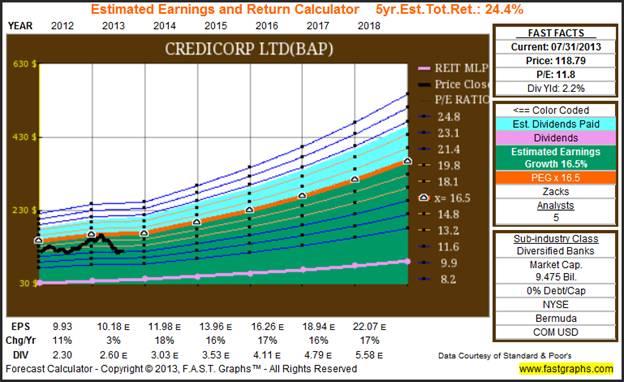
Credit Corp. Limited (BAP)
My first featured aggressive financial candidate is Credit Corp. Limited, a Bermuda-based financial services holding company, and the largest financial holding company in Peru. Although the company is headquartered in Bermuda and operates in Peru, its long-term track record is exceptional. Once again, I will let the F.A.S.T. Graphs™ speak for themselves, other than to say in addition to a great track record, this ADR is expected to offer above-average growth and appears to be very attractively valued at today’s levels.
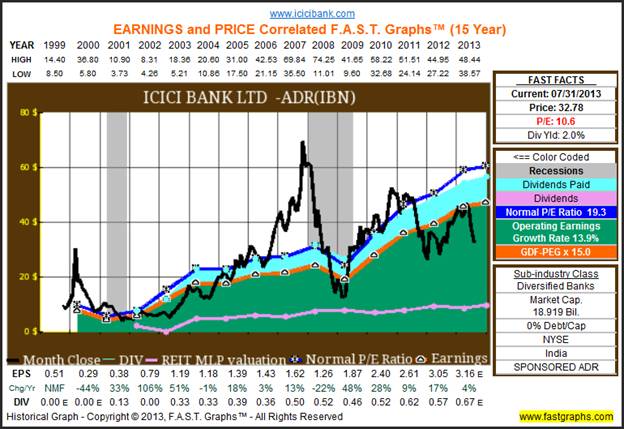
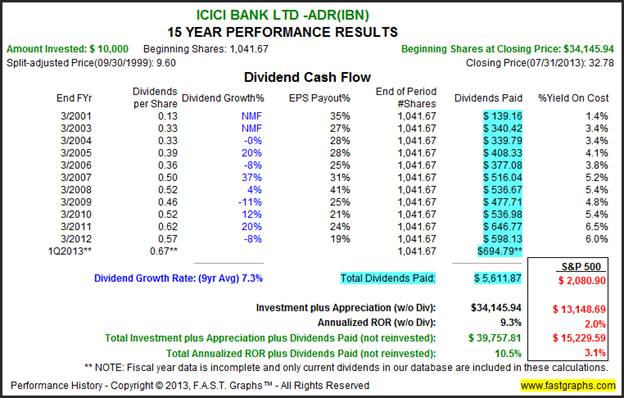
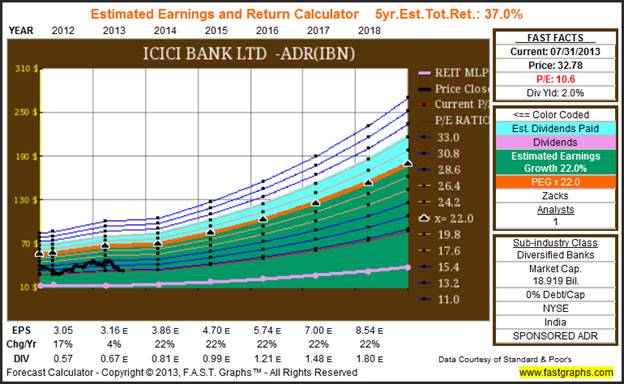
ICICI Bank Limited-ADR (IBN)
My second featured aggressive financial is ICICI Bank Limited-ADR (IBN), an ADR (American Depository Receipt) headquartered in India. This company is the largest private sector bank in India. Current low valuation is what most attracted me to this aggressive selection. However, I believe that prospective investors should carefully consider the amount of price volatility that has historically occurred with their share price. Nevertheless, for those dividend growth investors with a stomach for risk, this company may be worth taking a closer look at.
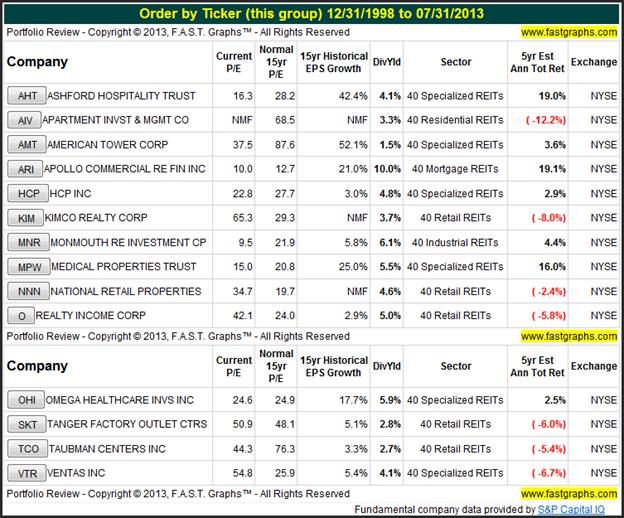
REITs
Although I do not consider myself an expert in REITs, a review of the Financial sector would not be complete without at least including them in my screen analysis. After going through most of the REITs that had established track records, I compiled the following list that I felt worthy of further scrutiny. I did include one mortgage REIT, and one REIT, American Tower Corp (AMT), that offered growth potential. Otherwise, I only included REITs that I felt were reasonably valued today and offered above-average current yields.
To be clear, I do not consider myself an expert in the subsector, but I did come across some selections that I felt might be worthy of additional research and consideration. Although I consider most of the companies on this list reasonably valued, there are also a few that I would consider fully valued. But I leave it up to the individual reader to make those determinations on their own cognizance. Frankly, I believe there are plenty of quality REITs available, but I also believe that many have extended valuations even in today’s low interest rate environment. Therefore, I suggest caveat emptor, or for those that don’t know Latin, let the buyer beware.
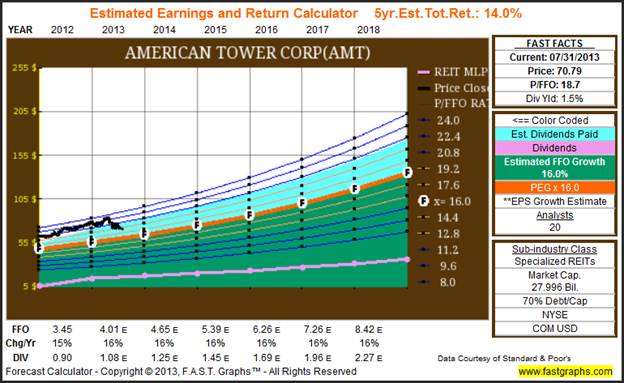
American Tower Corp.
I only include American Tower Corp because I felt it appeared to offer very interesting long-term growth prospects that were unique among the REIT subsector. Furthermore, it should be pointed out that American Tower Corp has only been a REIT since the beginning of calendar year 2012. Also, the reader should note that in contrast to most REITs, this particular selection does not offer a lot of dividend yield. However, it does offer intriguing growth prospects, especially if it can be purchased a little cheaper than it currently is priced.
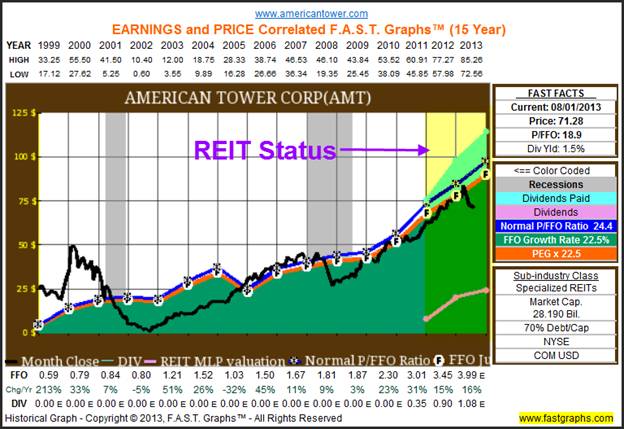
As I previously stated, what intrigues me most about this particular REIT is their prospects for growth. Although the current yield is very low relative to most REITs, they are expected to increase their dividend by 20% annually as their AFFO grows. Therefore, in contrast to your typical REIT, this particular example appears to emphasize growth and dividend growth over current yield. Nevertheless, I thought it was an interesting candidate for readers to examine.
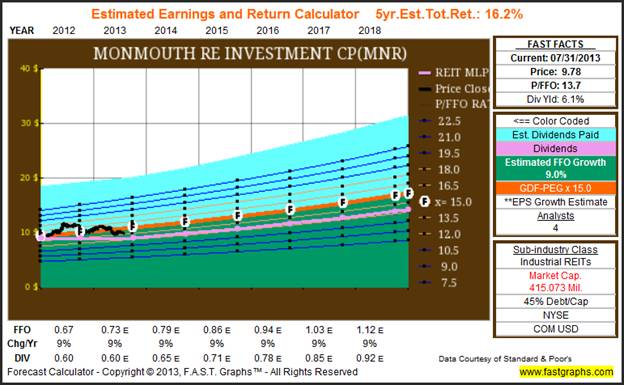
Monmouth Real Estate Investment Corporation (MNR)
My final REIT example is Monmouth Real Estate Investment Corporation, which I offer as an example for those investors most interested in current income. Although there is not a lot of growth with this particular REIT, their current yield exceeds 6%, and their attractive valuation is what intrigued me most. At first blush, Monmouth Real Estate Investment Corporation appears to be a potential candidate for yield-hungry investors in today’s low interest rate environment. Although I would stop short of calling it a bond alternative, I believe this particular REIT offers more bond like attributes than most other REITs I examined.
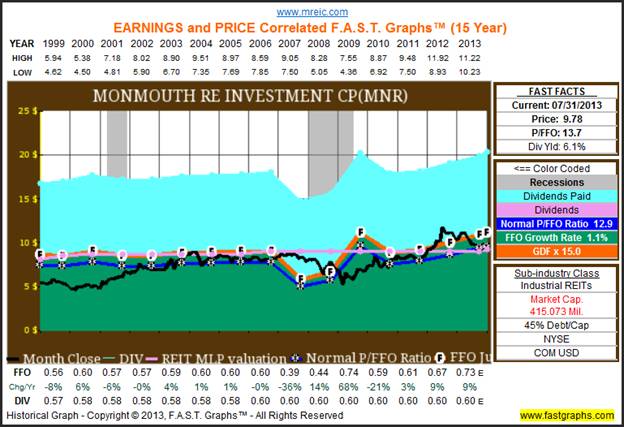
With the above said, it should also be pointed out that this company’s FFO growth rate has accelerated over the last 2 years from its typical 1% average to 9.2%. Perhaps this explains why the 4 analysts that are following the company and reporting to Capital IQ are forecasting 9% growth over the next 5 years. I am not sure that this is realistic or not, but is certainly worth a little research to find out. Additionally, this REIT has a long history of stability and consistency coupled with their above-average dividend yield. Historically, this REIT has produced very little growth, but has established a very consistent dividend distribution record. Consequently, if current yield is your objective, this REIT may be worth further scrutiny.
Summary and Conclusions
The Financial sector was a very interesting sector to examine. In spite of all the controversy that has surrounded this sector in recent years, I was able to find many candidates that I felt possessed quality and consistent long-term opportunities. However, what I did not adequately reflect in this article, is how diverse the Financial sector really is. There were many companies excluded simply because their historical operating results did not meet my standards of quality and consistency.
For those investors interested in banks, it appears that the Canadian banking sector offers numerous attractive opportunities. There were two domestic banks that I felt looked intriguing, but both would represent turnaround situations as they recovered from the Great Recession of 2008. Those banks were Wells Fargo and M&T Bank. However, only Wells Fargo was featured in the article.
My next article will cover Sector 45 – Information Tech.
Disclosure: Long C, WFC and AFL at the time of writing.By Chuck Carnevale
Charles (Chuck) C. Carnevale is the creator of F.A.S.T. Graphs™. Chuck is also co-founder of an investment management firm. He has been working in the securities industry since 1970: he has been a partner with a private NYSE member firm, the President of a NASD firm, Vice President and Regional Marketing Director for a major AMEX listed company, and an Associate Vice President and Investment Consulting Services Coordinator for a major NYSE member firm. Prior to forming his own investment firm, he was a partner in a 30-year-old established registered investment advisory in Tampa, Florida. Chuck holds a Bachelor of Science in Economics and Finance from the University of Tampa. Chuck is a sought-after public speaker who is very passionate about spreading the critical message of prudence in money management. Chuck is a Veteran of the Vietnam War and was awarded both the Bronze Star and the Vietnam Honor Medal.
© 2013 Copyright Charles (Chuck) C. Carnevale - All Rights Reserved Disclaimer: The above is a matter of opinion provided for general information purposes only and is not intended as investment advice. Information and analysis above are derived from sources and utilising methods believed to be reliable, but we cannot accept responsibility for any losses you may incur as a result of this analysis. Individuals should consult with their personal financial advisors.
Chuck Carnevale Archive |
© 2005-2022 http://www.MarketOracle.co.uk - The Market Oracle is a FREE Daily Financial Markets Analysis & Forecasting online publication.