


Gold Price Finally Ready to Launch
Commodities / Gold and Silver 2013 Jul 31, 2013 - 12:49 PM GMTBy: Submissions

 Bob Loukas writes: Gold appears to have wakened from what has been a very challenging 10 month decline. Ever since last September’s rally failed (bull trap) to take out the all-time high set back in 2011, it has literally been straight downhill for gold. But the signs of a trend change are everywhere now, and this is evident technically in the charts and within the changing composition of the Cycles. Be warned we are due a $50 pullback this week towards a Daily Cycle Low. However beyond that, all indications point to a substantial rally about to take hold. According to my Cycles analysis, we’re looking at a 10 week gold rally back to the $1,520-50 region.
The Weekly Cycle
There are plenty of reasons to get excited here, as the early developments of this new Weekly Cycle point to a longer term trend change. Gold is now 4 good weeks into a Weekly Cycle (these Cycle average 20 weeks) which was confirmed once it broke above the declining trend-line and the Weekly Swing Low point (Above $1,301). The technical indicators show strength is building while the slow moving weekly oscillators are beginning to bullishly cross. There is no way of knowing for sure how far this Cycle will run, but the early indications are very encouraging as the Cycles on every time-frame are turning higher.
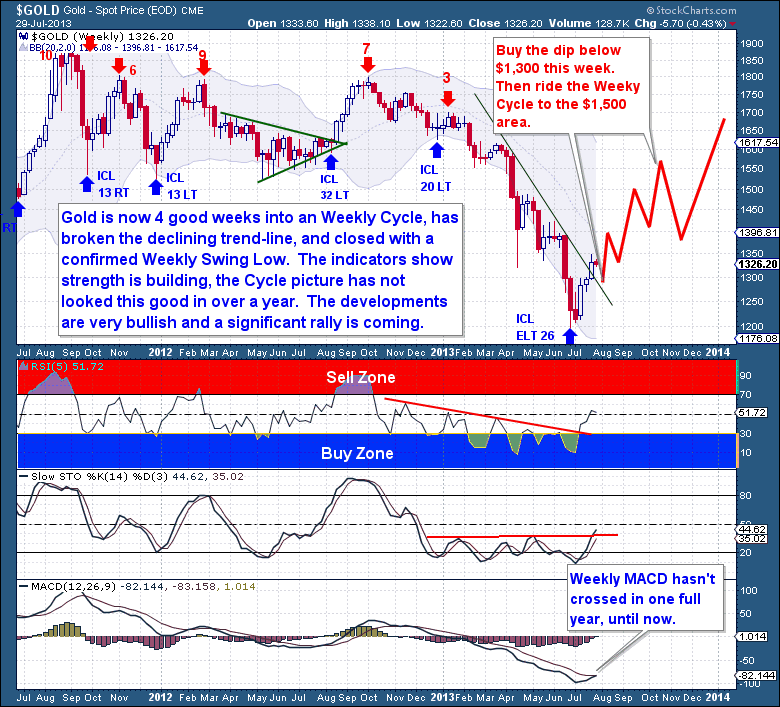
With a new Cycle, we’re on the eve of yet another significant rally. We know from past experience that big Right Translated Weekly Cycles can easily gain 25% before topping. When we look at the weekly chart there is some volume resistance at the $1,400 area, but besides that it’s clear sky back up to the $1,520-50. It’s at that area where gold was supported numerous times in the past before eventually collapsing, and it’s at that level where resistance will now be found. That area is where plenty of trapped longs can still be found and it’s where this coming Weekly Cycle rally will top.
Precious Metal Miner Confirmation
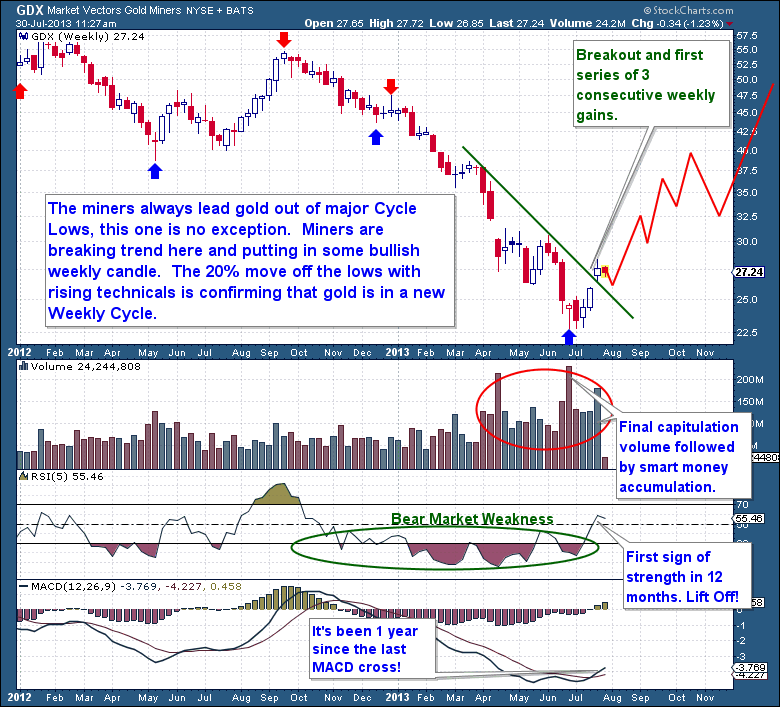
I love looking towards the miners for confirmation of where gold could be headed. We know from experience that the miners most often lead gold out of Cycles, and that is especially true around the major turning points.
The miners are up 20% in just 4 weeks and they’re breaking out of the established bear market downtrend. Unlike past failed attempts, this time the miners are showing great accumulation volume and rising relative strength. With the first weekly MACD cross in over year, this is exactly the type of evidence we’ve been seeking to confirm gold has found a major low.
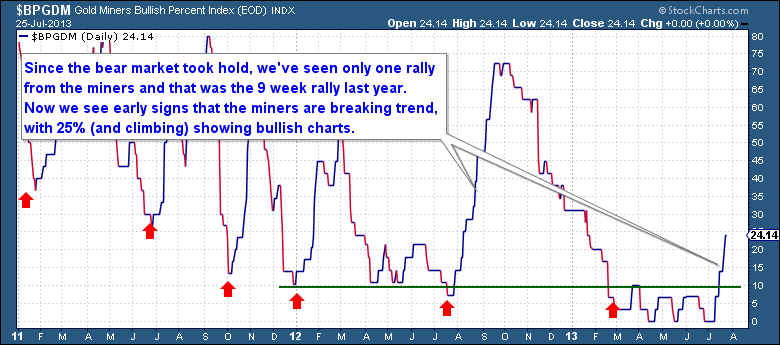
The strength in the miners chart is showing up on the bullish percent chart. This is an indicator that measures the percentage of miners that are now showing bullish long term P&F charts. We've witnessed only one significant rally since the bear market took control early last year. Coincidentally that was a massive 9 week rally that started almost at the same time last year. So now with 25% (and climbing) of stocks showing bullish charts, we’re seeing early signs that the miners are breaking the long established trend and beginning a powerful new rally.
COT Confirmation
As seen within the COT reports, the speculative short positions were recently at record levels. But as is the case at key turning points we’re seeing open interest spike while the record short positions have since receded, evidence they are being forced to cover positions. That’s a result of this 4 week Weekly Cycle rally, the higher gold moves the more speculative shorts will begin to panic and start covering their positions. This process creates a sell-fulfilling feedback loop and as they begin to cover their positions they become the driving force of the next big rally.
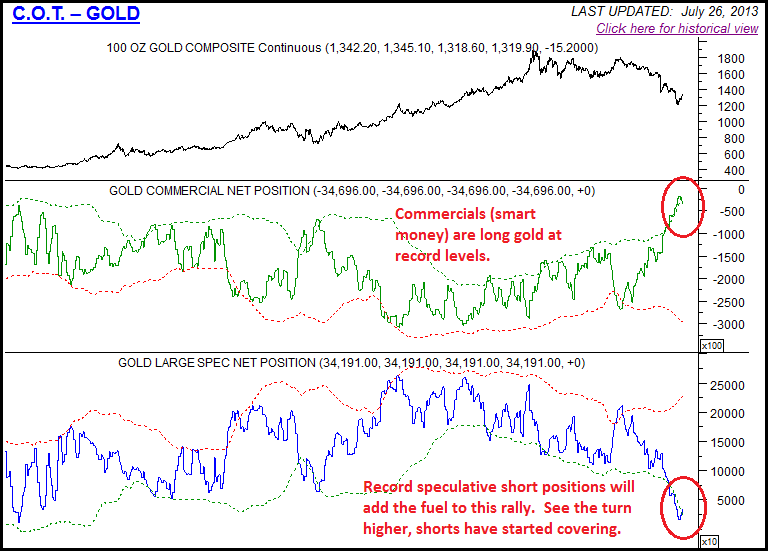
Courtesy Sentimentrader.com
Gold’s 4 Year Cycle – New Bull Market
I believe the bear market and therefore the 4 Year Cycle in gold is now over, but of course without real confirmation that statement remains just an opinion. Yes gold has broken the weekly declining trend-line, which confirms a new Investor Cycle. But to confirm an end to this bear market gold needs a monthly close above $1,423. That’s currently monthly Swing Low level and with gold’s monthly chart showing early signs of turning, any move above $1,423 will also provide technical confirmation too. During the 2009-2011 gold bull run every Weekly Cycle topped after week 10. But since the Aug 2011 top, they have all topped well before week 10. All forming in Left Translated fashion, those are classic bear market Cycles we experienced.
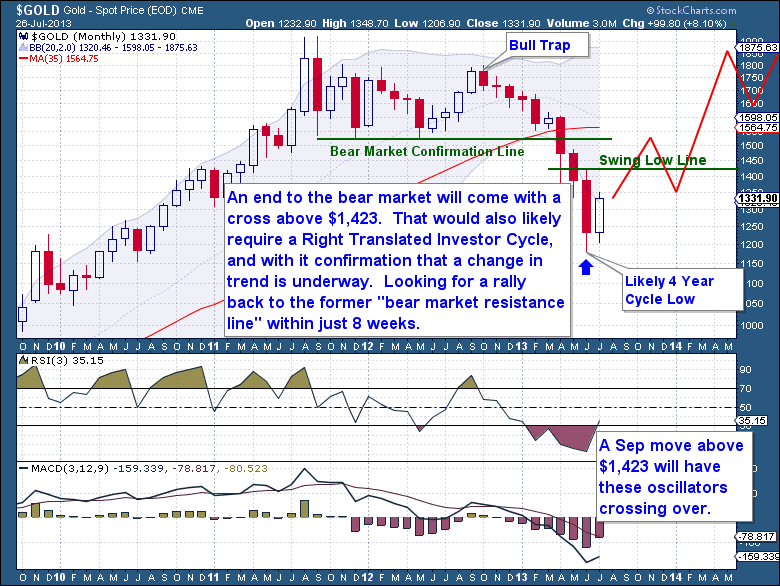
If gold is to close above $1,423 it will break that trend and it will likely put in the first Right Translated Weekly Cycle (Top after week 10) in over 2 years. That’s the type of action that will confirm that this is a new 4 Year Cycle and more importantly the end of this bear market. Although I firmly believe we will get there within the next 12 weeks, only then can we truly entertain the prospect of a new cyclical bull market.
The Financial Tap publishes two member reports per week, a weekly premium report and a midweek market update report. The reports cover the movements and trading opportunities of the Gold, S&P, Oil, and $USD Cycles. Along with these reports, members enjoy access to three different portfolios and trade alerts. As these portfolios trade on varying timeframes (from days, weeks, to months), there is a portfolio to suit all member preferences. If you’re interested in learning more about The Financial Tap and the services offered, please visit http://thefinancialtap.com/landing/try#
© 2013 Copyright Bob Loukas - All Rights Reserved Disclaimer: The above is a matter of opinion provided for general information purposes only and is not intended as investment advice. Information and analysis above are derived from sources and utilising methods believed to be reliable, but we cannot accept responsibility for any losses you may incur as a result of this analysis. Individuals should consult with their personal financial advisors.
© 2005-2022 http://www.MarketOracle.co.uk - The Market Oracle is a FREE Daily Financial Markets Analysis & Forecasting online publication.