


Gold Bullion and Gold Stocks Potential Upside Price Targets
Commodities / Gold and Silver 2013 Jul 12, 2013 - 11:59 AM GMTBy: Jordan_Roy_Byrne

 Obviously, we can't know if the bottom is in but I'll repost a chart which is my best argument for why we can expect a big rebound over the coming months. The chart shows all of the worst bear markets in gold stocks. At the top right I've annotated the ensuing recoveries. As you can see, D (the HUI from its 2011 top to last Friday's close) is extremely close to B and C in terms of depth and duration. B and C occurred in a secular bull market and were followed by 606% and 560% gains. D is also close to E which was followed by a 205% gain in seven months. A, the 2008 collapse was followed by a 324% gain in less than three years.
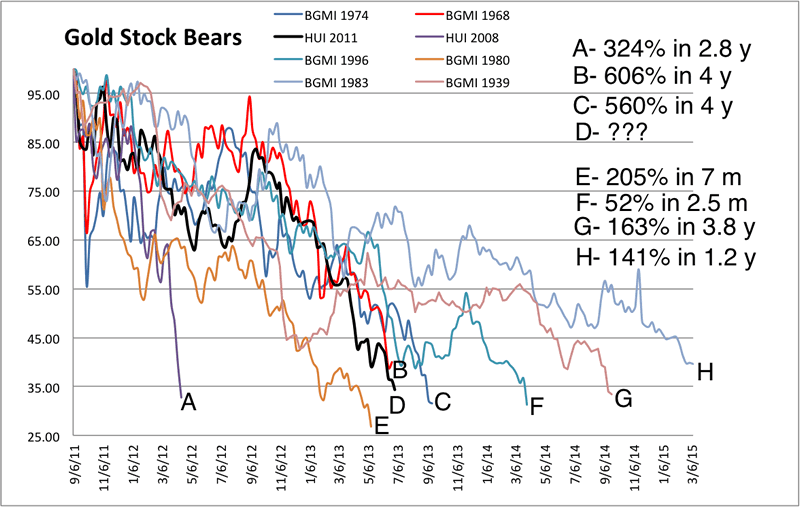
The chart and data show that the recent downturn is well in-line with the history of gold stocks and more importantly, is well in-line with downturns in secular bull markets. Yet, the mainstream is acting as if gold stocks are going to go 0 and the industry extinct. The recent drivel from talking heads on CNBC and Yahoo Finance is exactly what you get at a major bottom. Simply put, it is the perfect contrarian opportunity and is the foundation needed for a cyclical bull market and future bubble.
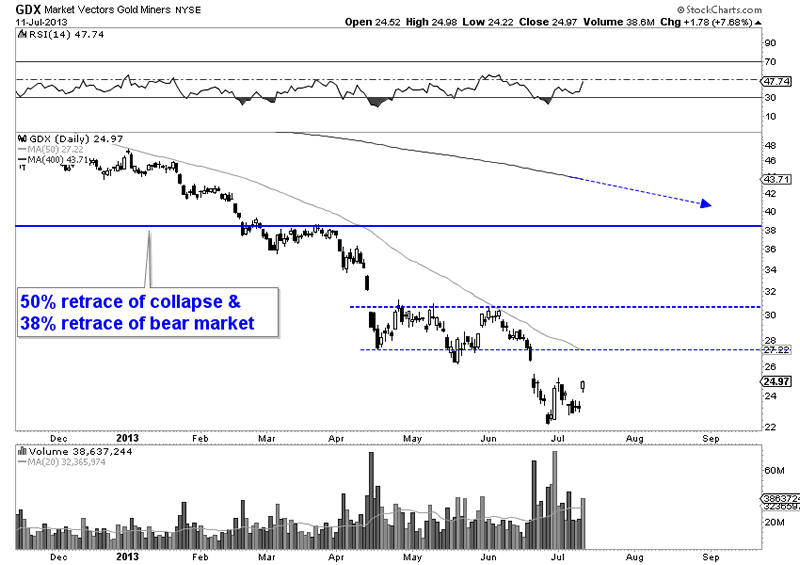
Moving along, the gold stocks have a very strong resistance target which could come into play in Q4 of this year. GDX, the large-cap unhedged miners ETF has a confluence of retracement points near $38. Meanwhile, the current 400-day MA is at $43.71 and will likely come down to $38 before the end of the year. Following four major bottoms (1970, 1976, 2000 and 2008), the recovery hit that resistance (400-day MA) in the fourth or fifth month post-bottom. Finally, GDX's low is at $22 and there is some critical resistance at $30. A very complex head and shoulders pattern could be developing and that would target $38. In the meantime, both the 50-day moving average and lateral resistance are at $27 which is the next key resistance.
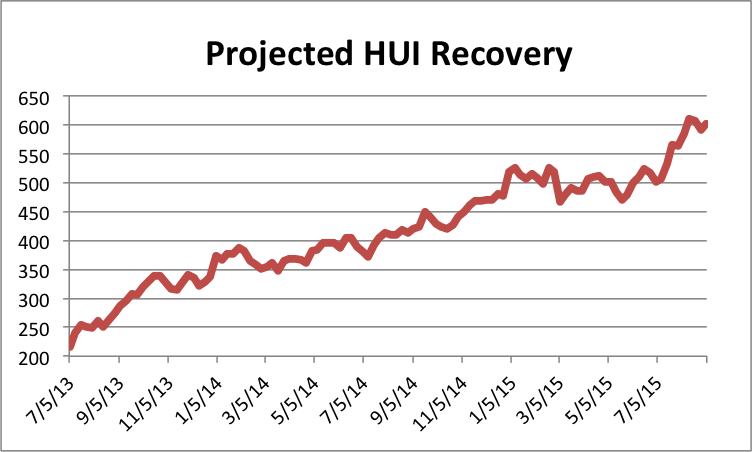
The equivalent to the GDX $38 target for the HUI is ~365. We looked at the price action following the major bottoms of gold stocks within a secular bull (1970, 1976, 2000, 2008) and combined the data into one. We applied that to last Friday's close (215) and the result is below. The recovery template has the HUI rallying to 350 and then correcting for a few months before rallying up to 390. Then the HUI consolidates for another five months before breaking past 400 in August 2014.
We did the same thing with Gold. We looked at how Gold performed following its bottoms in 2004, 2006 and 2008 and merged the data into one. Then we applied it to last week's close of $1212. (Note that we did not include 1976. If we did the recovery template would be much stronger). The projection shows Gold's initial rebound peaking around $1500 in February 2014. Then it would consolidate until next summer. This makes sense considering the big breakdown occurred just above $1500. It is likely to mark the first big resistance post-bottom.
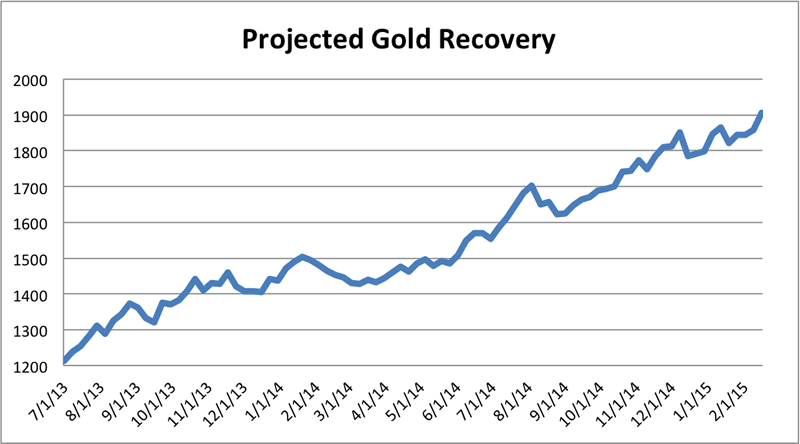
The projection shows Gold breaking past $1900 about 18 months from now. That would mark about three and a half years since the summer 2011 peak. After its peak in 1974, it took Gold three years to retest the high and three and a half years to make a new all time high.
To sum things up, we can't know for sure if Gold has already bottomed or not. If it isn't look for $1080 to be the final low. Regardless, our gold stock bears chart illustrates that we are on the cusp of a major bottom. It may already be in or it could happen in a few weeks. We don't know. On the other hand we do know that each passing day and week brings us much closer to a probable big recovery. Those who have the courage to buy any weakness will be handsomely rewarded and history shows us it usually is in short order. I'm sitting on losses and hope the bottom is already in. More important is the fact that the medium term potential far outweighs the risk of a final minor leg down. Moreover, some individual stocks have already bottomed or will confirm their bottoms if there is a minor leg down.
If you'd be interested in professional guidance in this endeavor, then we invite you to learn more about our service.
Good Luck!
Bio: Jordan Roy-Byrne, CMT is a Chartered Market Technician, a member of the Market Technicians Association and from 2010-2013 an official contributor to the CME Group, the largest futures exchange in the world. He is the publisher and editor of TheDailyGold Premium, a publication which emphaszies market timing and stock selection for the sophisticated investor. Jordan's work has been featured in CNBC, Barrons, Financial Times Alphaville, and his editorials are regularly published in 321gold, Gold-Eagle, FinancialSense, GoldSeek, Kitco and Yahoo Finance. He is quoted regularly in Barrons. Jordan was a speaker at PDAC 2012, the largest mining conference in the world.
Jordan Roy-Byrne Archive |
© 2005-2022 http://www.MarketOracle.co.uk - The Market Oracle is a FREE Daily Financial Markets Analysis & Forecasting online publication.