


Gold Price Cycles A Low About NOW?
Commodities / Gold and Silver 2013 Jul 11, 2013 - 03:07 PM GMTBy: DeviantInvestor

 Background: Gold prices peaked in September 2011 and have dropped over one-third in the past 22 months. Sentiment by almost any measure is currently terrible. Few in the US are interested in gold (although gold is selling well in China), most have lost money (on paper) if they bought in the last two years, and the emotional pain seems considerable. It reminds me of the S&P, gold, and silver crashes in 2008-9.
So, will gold drop under $1,000 or rally back above $2,000?
To help answer that question, I examined the chart of gold for the last 25 years and identified several long-term cycles. Then, I constructed a spreadsheet that attempted to model the price of weekly gold based on those cycles and a few assumptions.
Assumptions
- Use only long-term cycles – a year or longer.
- The weight assigned to each cycle is approximately proportional to its length. A 200-week cycle should be approximately twice as heavily weighted as a 100-week cycle.
- This is NOT a trading vehicle but a long-term indication of reasonable price projections based on past relationships. Those past relationships may or may not continue, even if they have been valid for over 20 years.
- Keep it simple. Do not over-complicate the model or aggressively “curve-fit” it.
- Prices are assumed to rise more slowly than they fall, so 62% of the cycle is related to the rising portion of the cycle, and 38% of the cycle is related to the falling portion of the cycle.
Data
- Low-to-Low cycles: 100 weeks, 122 weeks, and 162 weeks
- High-to-High cycles: 88 weeks and 270 weeks
- Exponential growth: 1/1/1990 – 1/01/2002: growth of negative 3.0%/year, and 01/01/2002 – present: 18% per year, calculated weekly
Process
Find the beginning dates (lows) for the 100, 122, and 162 week cycles and assign those beginning dates an index value of -1.0. Proportionally increase those index values from -1.0 to +1.0, and then reduce those index values from +1.0 to – 1.0, and repeat for each low-to-low cycle. Use the beginning index value on the 88 and 270 week high-to-high cycles as + 1.0. Extend the proportional increases on all time cycles from -1.0 to + 1.0 so that the rising period takes 62% of the cycle time.
Assign each cycle a weight approximately proportional to the cycle length. Use a beginning value and calculate the exponential increase (-3% or +18% per year) for each week, and then add or subtract the percentage changes for each weekly time cycle. Adjust the cycle index weights to obtain the best visual fit on a graph of actual gold prices versus the calculated price of gold.
What Could Go Wrong?
- The exponential increase might not continue from 2013 forward. I expect gold prices to accelerate higher, but it is possible that they will continue falling. See Caveats.
- The cycles, although relevant for over 20 years, might be less relevant from 2013 forward.
- The calculated price was “curve-fit” to the actual prices, and that “curve-fit” result might be less accurate from 2013 forward.
Results
Statistical correlation over the last 20 years is slightly larger than 0.97 (quite high). The calculated gold price is generally consistent with the actual gold price, even though occasional large variations are clearly evident.
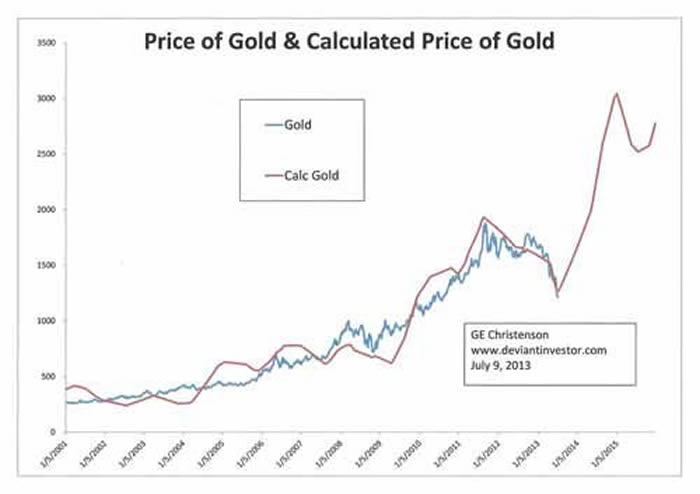
Highlights: (based on weekly closing prices)
Calculated high: December 2006 at $779 Actual high: May 2006 at $712
Calculated high: April 2008 at $784 Actual high: March 2008 at $999
Calculated low: April 2009 at $618 Actual low: October 2008 at $718
Calculated high: August 2011 at $1,931 Actual high: September 2011 at $1,874 (daily high was $1,923)
Calculated low: July 2013 at $1,267 Actual low: July 2013 at $1,213 (actual weekly low, so far)
The Future
This simple model, which uses only five cycles and an exponential increase, indicates that a low in the gold price is expected approximately now (May – October 2013), and that the next high is projected for approximately September 2014 – June 2015, possibly in the $2,500 – $3,500 range. (From the current lows, a price of $3,000 seems unlikely, but gold traded below $700 in October 2008 and rose to over $1,900 by September 2011, so a substantial rise is quite possible.)
Caveats!
There are many. This is not a prediction; it is simply a projection based on the entirely reasonable, but possibly incorrect, assumption that gold prices will continue to rise about 18% per year, on average, and that these five cycles will push actual prices well above and below that exponential growth trend.
Why will gold prices continue to increase? Our current monetary system depends upon an exponentially increasing debt and money supply. It seems likely that the US government will continue to run massive budget deficits and thereby increase total debt. In addition, the central banks of Japan, the EU, and the US will continue to monetize debt and increase the money supply to promote asset inflation and to overwhelm the deflationary forces in their respective economies. Gold supply increases slowly, the demand increases more rapidly, while each Dollar, Euro, and Yen purchase less, on average, each year. It seems quite reasonable to expect that gold (and silver) prices will increase substantially from their current low level. Read: Gold & What I Know for Certain.
Timing: The model was basically correct (over the last decade) on timing and price with some large variations. Clearly, there are more factors driving the price of gold than five simple cycles. Those political, HFT, emotional, and economic factors will inevitably push the price higher or lower, sooner or later, than the model indicates. Regardless, the model has some value indicating the approximate price and timing for long-term highs and lows in the price of gold.
Use it while appreciating its limitations. Read: Back To Basics: Gold, Silver, and the Economy.
aka Deviant InvestorIf you would like to be updated on new blog posts, please subscribe to my RSS Feed or e-mail
© 2013 Copyright Deviant Investor - All Rights Reserved Disclaimer: The above is a matter of opinion provided for general information purposes only and is not intended as investment advice. Information and analysis above are derived from sources and utilising methods believed to be reliable, but we cannot accept responsibility for any losses you may incur as a result of this analysis. Individuals should consult with their personal financial advisors.
© 2005-2022 http://www.MarketOracle.co.uk - The Market Oracle is a FREE Daily Financial Markets Analysis & Forecasting online publication.