


Gold Price Moves from the European Perspective
Commodities / Gold and Silver 2013 Jul 06, 2013 - 09:23 AM GMTBy: P_Radomski_CFA

 Despite the lack of trading activity in the United States due to the Independence Day celebrations, yesterday's session in Europe was very interesting. The players on the foreign exchange market have provided plenty of thrills. Without a doubt, the ECB President's announcement was fuel for further dynamic declines in the euro. Draghi said the bank expected its key interest rates to remain at current or lower levels for an extended period. The ECB left its main interest rates unchanged as expected at record lows of 0.5 percent. Market reaction was swift and pronounced. The European currency dropped to a five-week low against the dollar.
Another important event was the statement by the Bank of England, which signaled that it won't be raising interest rates anytime soon, lifting the FTSE 100 and putting big pressure on the British pound which fell 1.2%.
"I think this is very much a calm before the storm ... the U.S. is out today and the focus is all on non-farm payrolls tomorrow, which I think is potentially the storm - if the data comes in line with expectation there may be more selling for gold," Jonathan Butler, precious metals strategist at Mitsubishi, added.
According to Reuters, Friday's U.S. non-farm payrolls report is expected to show the economy created 165,000 jobs last month. The data could affect when the Federal Reserve will begin tapering off its $85 billion monthly bond-buying stimulus program.
Gold posted its biggest quarterly loss on record in the April-June period, down 23 percent. Selling was exacerbated by comments from the Fed Chairman Ben Bernanke last month that the U.S. economy was recovering strongly enough for the central bank to begin pulling back on its stimulus in the next few months.
This would support a rise in interest rates, making gold less attractive.
Since we know the important news from Europe and the economic calendar, let's summarize gold's current situation. The yellow metal has increased since hitting its lowest price in almost three years at $1,180 last Friday, but many traders view those gains as a typical short-term rally that follows a significant decline. Is that true? Will we see a further decline? Let's take a look at the charts and try to find the answers. At the beginning let's take a look at the long-term gold chart and check the current situation in gold (charts courtesy by http://stockcharts.com.)
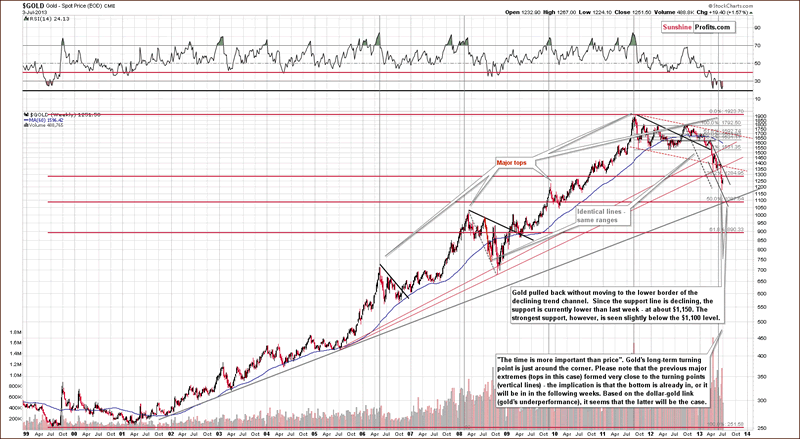
In this week's very long-term gold chart, we see that prices moved close to the lower border of the declining trend channel. This price level was not quite reached, but gold's price is very close to it, and it seems that prices will decline once again. Gold has been trading sideways below an important resistance line, the first Fibonacci retracement level, verifying this breakdown. With a verified breakdown and the declining trend channel in place, we have a bearish outlook at this time.
Gold could initially decline to the lower border of the trend channel and if it does, a pullback will likely follow. However, since the support line is declining, the support is currently lower than last week - at about $1,150. The strongest support is seen slightly below the $1,100 level where two major support lines intersect.
Therefore, from this perspective, the situation remains bearish for the short term and it doesn't look so optimistic. However, if we want to have a more complete picture of the situation, let's take a look at the chart from the non-USD perspective.
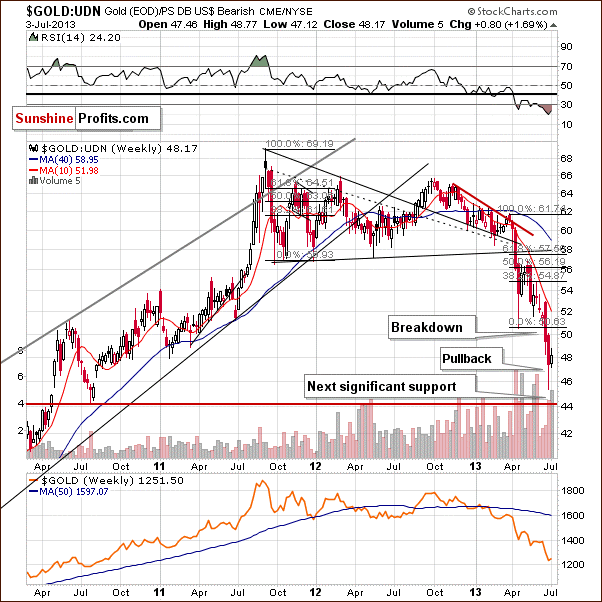
Gold viewed from this perspective showed very little change this week as prices moved higher, then lower, and are within 2% or so of where they were a week ago. No significant support level has been reached, so declines could very well continue here.
As we previously mentioned, yesterday the British pound depreciated strongly against the U.S. dollar which means an increase of the strength of the U.S. dollar. Unfortunately, such a development could have negative consequences for gold. In light of this information, we think that another interesting chart may provide important clues about further price movements is the chart of gold from the perspective of the British pound.
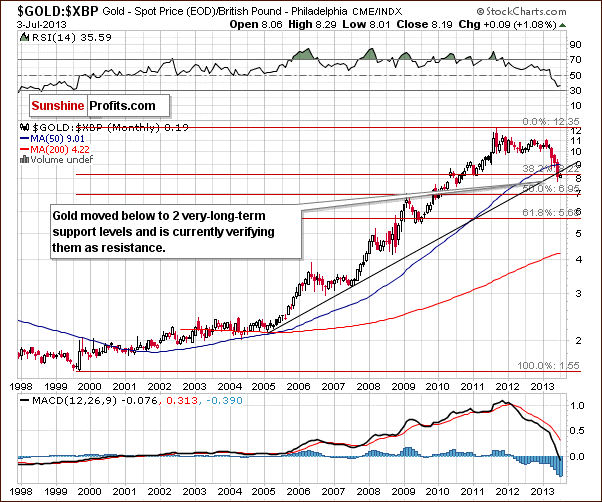
Gold priced in British pounds reveals a recent double breakdown. This is a breakdown below two important support levels, in this case the rising long-term support line and the first Fibonacci retracement level on the full bull market.
This is an important breakdown and, at this time, the next significant support line is slightly below the 7 level in this chart. Clearly another significant decline could be seen here. This is similar to what we saw last week when gold moved lower, and we could see a similar move once again later on in the month.
Since we are already in Europe, we think that we can't forget to take a look at the current situation of the European currency. Thus, to make the European perspective complete let's see what has changed recently in the Euro Index chart.
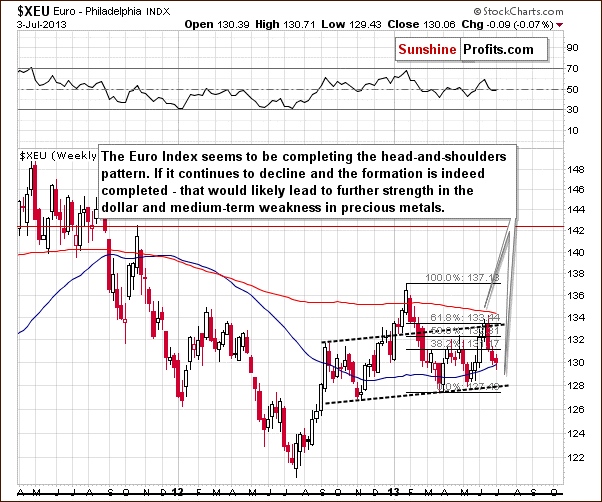
In this week's Euro Index chart, we see that the head-and-shoulders pattern remains in place. The Euro declined once again this week, and it seems to be completing the pattern. The chances for this formation to be invalidated are growing increasingly slim. If the European currency continues to decline and the formation is indeed completed, this may lead to further strength in the U.S. dollar and medium-term weakness in precious metals. From this point of view, this chart is still bearish.
Summing up, gold pulled back this week but the move to the upside did not invalidate the most important resistance levels. From the European point of view, the outlook and trend remain bearish for the short term. The immediate-term could see some strength, but with support lines relatively far away, the next big move will likely be to the downside.
Please note that these are very volatile times for gold investors and the situation may quickly change (become bullish) if we see strong moves up in the USD Index without a meaningful decline in gold and bearish indications from other markets.
Thank you for reading. Have a great and profitable week!
To make sure that you are notified once the new features are implemented, and get immediate access to our free thoughts on the market, including information not available publicly, we urge you to sign up for our free gold newsletter. Sign up today and you'll also get free, 7-day access to the Premium Sections on our website, including valuable tools and charts dedicated to serious Precious Metals Investors and Traders along with our 14 best gold investment practices. It's free and you may unsubscribe at any time.
Przemyslaw Radomski, CFA
Founder, Editor-in-chief
Gold & Silver Investment & Trading Website - SunshineProfits.com
* * * * *
About Sunshine Profits
Sunshine Profits enables anyone to forecast market changes with a level of accuracy that was once only available to closed-door institutions. It provides free trial access to its best investment tools (including lists of best gold stocks and best silver stocks), proprietary gold & silver indicators, buy & sell signals, weekly newsletter, and more. Seeing is believing.
Disclaimer
All essays, research and information found above represent analyses and opinions of Przemyslaw Radomski, CFA and Sunshine Profits' associates only. As such, it may prove wrong and be a subject to change without notice. Opinions and analyses were based on data available to authors of respective essays at the time of writing. Although the information provided above is based on careful research and sources that are believed to be accurate, Przemyslaw Radomski, CFA and his associates do not guarantee the accuracy or thoroughness of the data or information reported. The opinions published above are neither an offer nor a recommendation to purchase or sell any securities. Mr. Radomski is not a Registered Securities Advisor. By reading Przemyslaw Radomski's, CFA reports you fully agree that he will not be held responsible or liable for any decisions you make regarding any information provided in these reports. Investing, trading and speculation in any financial markets may involve high risk of loss. Przemyslaw Radomski, CFA, Sunshine Profits' employees and affiliates as well as members of their families may have a short or long position in any securities, including those mentioned in any of the reports or essays, and may make additional purchases and/or sales of those securities without notice.
Przemyslaw Radomski Archive |
© 2005-2022 http://www.MarketOracle.co.uk - The Market Oracle is a FREE Daily Financial Markets Analysis & Forecasting online publication.