


Inflation’s Shot Across the Bow, Deflationary Pressure is Expected to Resurface
Stock-Markets / Deflation Jul 03, 2013 - 06:43 AM GMTBy: Clif_Droke

 On May 3, the bond market fired the proverbial “shot heard ‘round the world.” Treasury yields began a two-month climb to levels not seen in almost two years. Many analysts proclaimed the end of the 30+ year interest rate decline. The true significance in the yield rally isn’t that the long-wave deflationary trend in interest rates is over, however. Rather, it’s that the commencement of long-term inflation is within sight.
While the rally in Treasury yields does have longer-term significance, it’s still far too early to assume the downtrend in yields is over. As we’re still some 15 months away from the bottom of the 120-year cycle of inflation/deflation we can only assume the downward trend in interest rates remains intact. Additionally, as real estate analyst Robert Campbell has pointed out, “until the actions of the Fed speak otherwise, Fed policy is currently working to push mortgage rates down.”
The rally in Treasury yields, while impressive, should be put into context with the longer-term yield trend. Here’s what the Treasury Yield Index (TNX) looks like from the vantage point of a 2-year chart. In this relative short-term chart you can clearly see the attempt yields have made in establishing a new rising trend in relation to the steep drop in 2011-2012.
It’s only when we examine the long-term monthly chart of TNX that the true long-term trend becomes clear. The downtrend line that can be drawn by connecting the yield peaks from 1996 through 2011 hasn’t even been broken yet. The interest rate downtrend is therefore presumed to be still in force. It likely won’t be until after October 2014, when the Kress mega cycle bottoms, that we’ll finally see this downtrend broken.
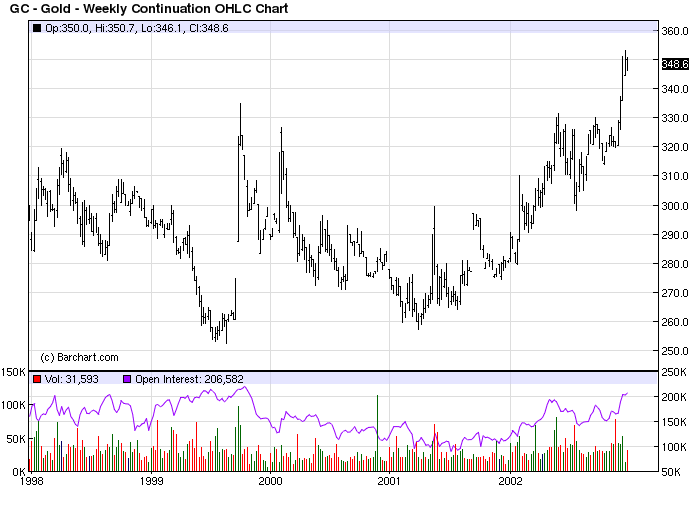
What then is the ultimate significance of the sharp rally in bond yields? The spike in yields can only be appreciated by making historical comparisons with markets that behaved in a similar fashion. For instance, gold was in a similar long-term downtrend from 1981 through 1999 when, in the autumn of ’99, the yellow metal unexpectedly launched a vigorous rally from its long-term low of nearly $250/oz. to a high of over $330/oz. in just a few short weeks (see chart below). This wasn’t the official beginning of gold’s long-term bull market, which would actually begin less than two years later. It was, however, an advance warning that a major change of gold’s long-term trend was in the making.
Comparing gold with bonds isn’t as dissimilar as some may think, for both are excellent barometers of longer-term global liquidity and inflation/deflation expectations. Of the two, interest rates are a more important indicator of inflation and deflation, so it will be especially important to monitory the interest rate trend in the coming months as we draw closer to the 120-year cycle bottom.
The ultimate meaning behind the short-term rally in Treasury yields can only be known with certainty after the facts have become clear. It’s still far too early to discern what those facts may be. Based on historical examples, however, it’s probable that the yield rally is a “shot across the bow” preliminary to the beginning of a new long-term inflationary trend starting in late 2014/early 2015.
U.S. Economy
The selling pressure which hit stocks and bonds in June left the U.S. retail economy unscathed.
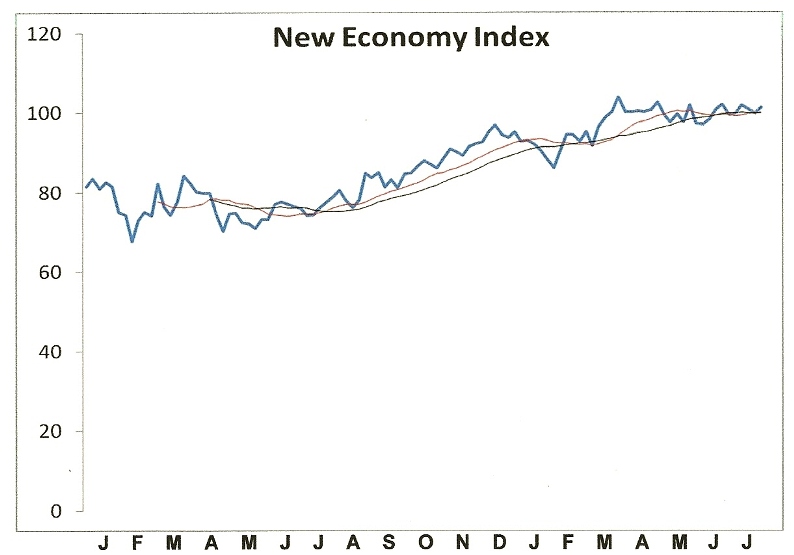
Among the individual corporate stock components of the New Economy Index (NEI), which measures the real-time strength of the economy, only Wal-Mart (WMT) took a sizable tumble in June. Monster Worldwide (MWW), the jobs component of the NEI, also plunged last month but its stock price accounts for only a small amount of the index.
Meanwhile Amazon (AMZN), EBay (EBAY) and FedEx (FDX) – the other important components of the index – are in varying degrees of health or recovery. The signals reflected in the stock price performance of these three stocks alone are worth a hundred conventional economic indicators of the type relied on by mainstream economists.
The NEI reading for last week was in line with the reading of recent weeks, viz. the NEI is still holding on above its 12-week and 20-week moving averages. The interim uptrend for the index remains intact (below), therefore we still have a confirmed “buy” signal for the U.S. economy.
Deflationary pressure is expected to resurface as we head closer to the final “hard down” phase of the long-term Kress cycle in 2014, but for now those pressures are confined mainly to Europe and Asia and haven’t yet appeared in the U.S. The domestic retail economy, along with the consumer spending that supports it, is still firm.
2014: America's Date With Destiny
Take a journey into the future with me as we discover what the future may unfold in the fateful period leading up to - and following - the 120-year cycle bottom in late 2014.
Picking up where I left off in my previous work, The Stock Market Cycles, I expand on the Kress cycle narrative and explain how the 120-year Mega cycle influences the market, the economy and other aspects of American life and culture. My latest book, 2014: America's Date With Destiny, examines the most vital issues facing America and the global economy in the 2-3 years ahead.
The new book explains that the credit crisis of 2008 was merely the prelude in an intensifying global credit storm. If the basis for my prediction continue true to form - namely the long-term Kress cycles - the worst part of the crisis lies ahead in the year 2014. The book is now available for sale at: http://www.clifdroke.com/books/destiny.html
Order today to receive your autographed copy and a FREE 1-month trial subscription to the Gold & Silver Stock Report newsletter.
By Clif Droke
www.clifdroke.com
Clif Droke is the editor of the daily Gold & Silver Stock Report. Published daily since 2002, the report provides forecasts and analysis of the leading gold, silver, uranium and energy stocks from a short-term technical standpoint. He is also the author of numerous books, including 'How to Read Chart Patterns for Greater Profits.' For more information visit www.clifdroke.com
Clif Droke Archive |
© 2005-2022 http://www.MarketOracle.co.uk - The Market Oracle is a FREE Daily Financial Markets Analysis & Forecasting online publication.