


Gold Stocks Low?
Commodities / Gold and Silver Stocks 2013 Jun 30, 2013 - 03:14 PM GMT

 I have been tracking a potential 5 wave decline in Gold stocks to help me also find a low in Gold.
Fridays reversal in both the $HUI and Gold was an encouraging sign for the bulls and whilst its only a 1 day move, it has the potential for something much more.
Off the lows we don't yet have a small 5 wave move, but it’s encouraging to see a decent reversal, every turn starts out with the not many believing the market has turned, but when i can count a market having made a 5 wave completed sequence, i go into DEFCON mode looking for evidence a potential reversal.
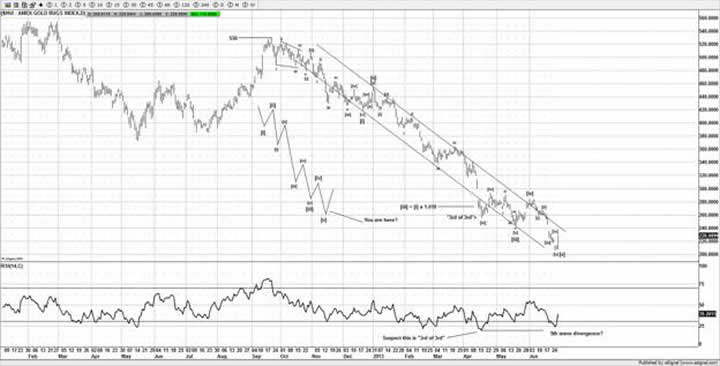
The reason i was holding off suggesting to members to buy Gold and Gold stocks was the lack of evidence of a completed 5 wave decline in the $HUI.
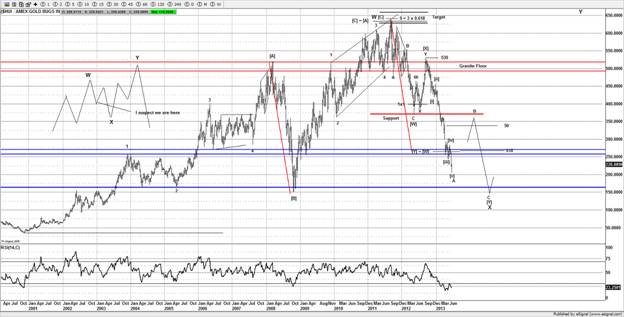
But now we might have some evidence to suggest the trend from the Sept 2012 high (530) is over and a strong counter trend rally is under way, one that could possibly take the $HUI back to the $350 area.
Short term we need to see a small 5 wave advance, followed by a small 3 wave pullback, which will offer traders the chance to get long with limited risk.
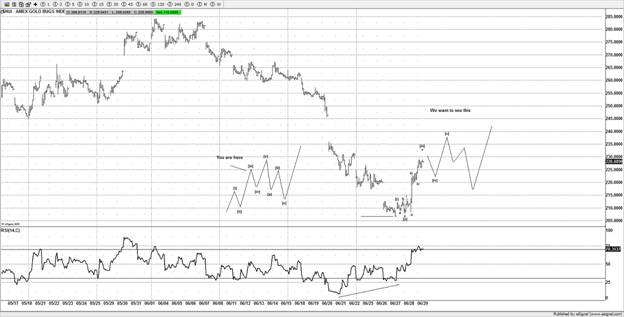
So rather that "take a stab" at the low, we have a controlled setup that we want to see before we put $$ to work, whilst many others have been completely wrong footed by this decline.
I have been recommending to members to stay well away from Gold and Gold stocks until we have a completed 5 wave decline in place, we now have some evidence to suggest we could have a strong setup for a trade able move.
ABX
If you are aware of the component makeup of the HUI, you will be aware then that Barrick Gold is a large component of the $HUI, in fact its number 2 in the weighting of the HU, so it pays to watch other stocks and their relative Elliott Wave counts.
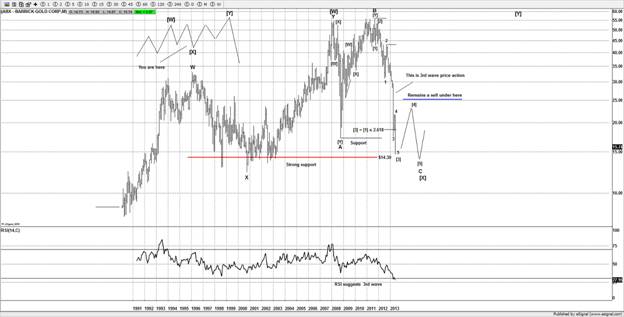
The monthly chart of ABC suggests wave [3] of a larger wave C is close if not completed, with the evidence shown last week, there is strong evidence a low could be in place.
With a decent bounce expected on the HUI based on its wave count, that should also align nicely with a bounce to around $20-25 on ABX, before new lows would be expected and finally completing long term patterns.
With Gold stocks probably one of the most hated investment vehicles around and a wave structure that looks complete, it makes for a low risk setup for a decent profitable trade, to those that have waited for the conditions to align.
Its times like these, that the if the conditions dictate, we need to rise in the face of fear and buy when not many are interested, I find the most profitable trades are when I go against the majority of the crowd, that's not to say we just fade the crown at any point, we still need a certain number of things to align.
As I write this, those conditions appear to be in place to offer a low risk setup, with minimum risk, the reward could be a substantial trade if it works out the way I suspect it will.
One day does not confirm reversal, but we have to start somewhere.
Until next time
Have a profitable week ahead
Click here to become a member
You can also follow us on twitter
What do we offer?
Short and long term analysis on US and European markets, various major FX pairs, commodities from Gold and silver to markets like natural gas.
Daily analysis on where I think the market is going with key support and resistance areas, we move and adjust as the market adjusts.
A chat room where members can discuss ideas with me or other members.
Members get to know who is moving the markets in the S&P pits*
*I have permission to post comments from the audio I hear from the S&P pits.
If you looking for quality analysis from someone that actually looks at multiple charts and works hard at providing members information to stay on the right side of the trends and making $$$, why not give the site a trial.
If any of the readers want to see this article in a PDF format.
Please send an e-mail to Enquires@wavepatterntraders.com
Please put in the header PDF, or make it known that you want to be added to the mailing list for any future articles.
Or if you have any questions about becoming a member, please use the email address above.
If you like what you see, or want to see more of my work, then please sign up for the 4 week trial.
This article is just a small portion of the markets I follow.
I cover many markets, from FX to US equities, right the way through to commodities.
If I have the data I am more than willing to offer requests to members.
Currently new members can sign up for a 4 week free trial to test drive the site, and see if my work can help in your trading and if it meets your requirements.
If you don't like what you see, then drop me an email within the 1st 4 weeks from when you join, and ask for a no questions refund.
You simply have nothing to lose.
By Jason Soni AKA Nouf
© 2013 Copyright Jason Soni AKA Nouf - All Rights Reserved
Disclaimer: The above is a matter of opinion provided for general information purposes only and is not intended as investment advice. Information and analysis above are derived from sources and utilising methods believed to be reliable, but we cannot accept responsibility for any losses you may incur as a result of this analysis. Individuals should consult with their personal financial advisors.
WavePatternTraders Archive |
© 2005-2022 http://www.MarketOracle.co.uk - The Market Oracle is a FREE Daily Financial Markets Analysis & Forecasting online publication.