


Time To Buy Gold Again?
Commodities / Gold and Silver 2013 Jun 30, 2013 - 02:03 PM GMTBy: Brian_Bloom

 The following interview with Jim Sinclair is highly significant in my view. (http://www.youtube.com/watch?v=GNjAg9x1_s8)
I find myself respecting what this man says and I think he is reading the gold market situation substantially correctly. He made four salient points in the first half of the talk (the second half was elaboration)
1. When the bordello is raided, even the piano may need to be sold by the owners so that they may survive in the immediate future. Thereafter, the facts of life re-establish themselves and they regroup. The gold price has been falling for various reasons, including a raid by the authorities. It will bottom when weak holders are forced to sell the piano. Thereafter, it will rise.
2. No currency will ever again be backed by gold. Fiat currency is used for transactions whilst gold is used for savings – i.e. as a means of protecting savings. [BB Comment: It doesn't matter whether this market perception regarding gold is right or wrong. If enough people believe it to be so then it is so]
1. If/when the dollar loses its status as the world's currency, gold will skyrocket. [BB Comment: As Mr Sinclair himself acknowledges, the jury is still out regarding the potential for this development, but the commencement of gold’s next rise will not necessarily be a function of the dollar’s fall.]
2. Gold will start to rise when Comex runs out of inventories - possibly around July.
All four of these points are consistent with what I am seeing on the charts. Gold may be approaching a bottom. One needs to recognise the possibility that the target of $785 on the 5% X 3 box reversal P&F chart may not be relevant because of artificial “manipulation” in the futures markets. Even if you only accept points 1, 2 and 4 above (which I am inclined to do) then gold may be approaching a bottom. The downside may be $100 whilst the upside is very likely greater than $1000 an ounce. That is a good risk/reward equation.
The chart below shows a possible reversal in the down trend that commenced in mid 2011:
Chart #1 – Daily Bar Chart of the Gold Price
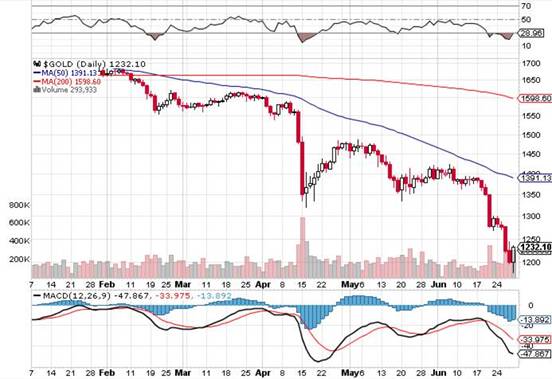
The question one has to ask one’s self is whether the bounce will look like the April 2013 bounce or whether we are facing a bullish sea-change. Looking at the length of the high/low bar on Friday June 28th, in context of the non-confirmation of the rising bottoms of the MACD, it is “possible” that the next rally may be very different from April’s rally.
The 3% X 3 box reversal chart shows a target if $1,109 and the current price is $1,232. Gold might fall another 10%. I think, on balance, one will be trying to be too clever by trying to catch the exact bottom.
Chart # 2: 3% X 3 Box reversal Point & Figure Chart of the Gold Price
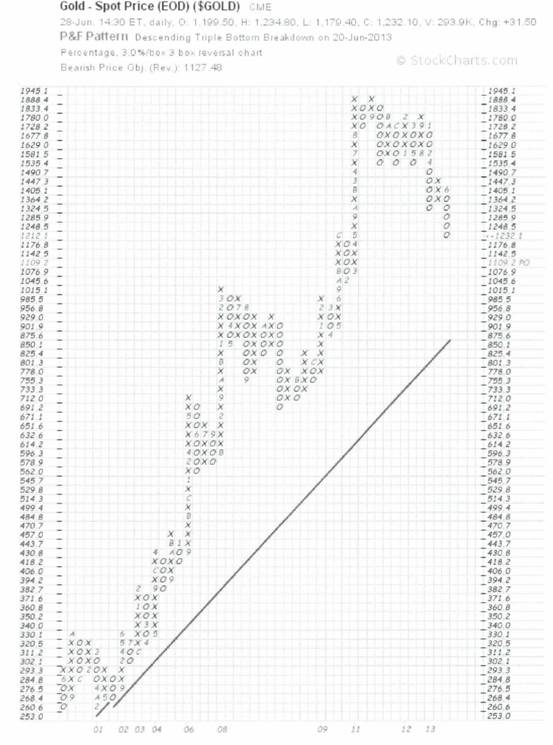
Of course, if the piano has to be sold then the price might fall to the target of $785 but, in context of Jim’s argument – with which I strongly agree – that fiat currency is for spending and gold is for saving, the error of timing might be rectified within a few months. I suspect we are heading for a period of growing (extreme?) volatility on all financial markets.
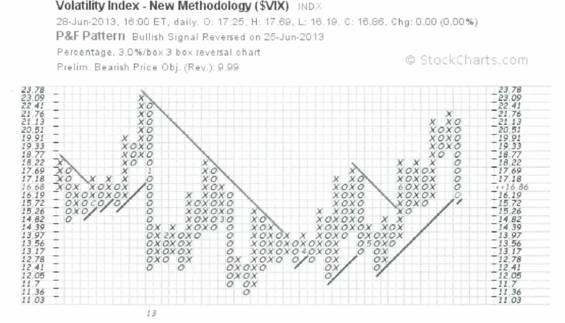
The P&F chart of the Volatility Index below has just given a “warning” signal that complacency is about to reassert itself in the markets because the $VIX might break below the rising trend line
Chart #3: Volatility Index, 3% X 3 box Reversal Point & Figure
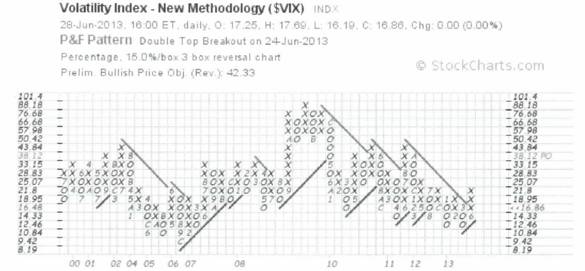
But we need to see this signal in context of the big picture. Below is the 10% X 3 box reversal chart. It is calling for a strong rise in the $VIX. Note how the length of the uptrend lines has been shortening since the GFC emerged and the Fed became more heavily involved in the markets. It’s almost as if the volatility has been slowly hypnotised into a state of sleep. Well, using that analogy, the latest signal in the chart below shows a market that may now be waking up from that sleep and that the short term sleep “signal” we have seen was really REM (rapid eye movement).
Chart #4: Volatility Index,15% X 3 box Reversal Point & Figure
There is no question in my mind that the signal on the more sensitive $VIX chart is a contrary indicator. For the $VIX to go lower than it currently is has soporific implications. Can anyone seriously believe that, under current circumstances in the world’s financial markets, investors are going to go remain in a deep sleep for much longer?
In terms of the chart below – of the $SPX – the market is still technically overbought.
Chart #5: Elliott Wave Analysis of Standard & Poor 500 Index
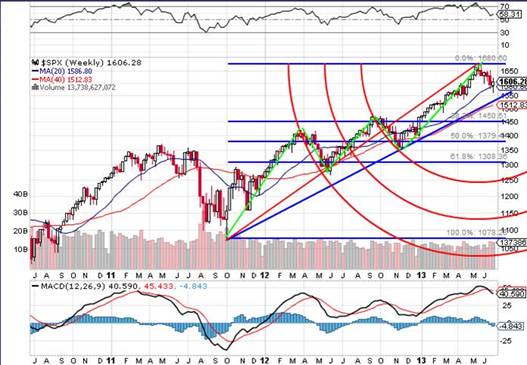
Since the 2011 bottom there have been five (green) up waves with wave 5 being extended relative to wave 3 but at a shallower angle of incline than wave 1. At very least we need to see a three wave downward reaction, and the timing of this is confirmed by the sell signal on the MACD. On a worst-case scenario, if Mr Sinclair is correct about his July/August/September timing, we might see the commencement of a five wave downward movement which, in turn, will be the beginning of a Primary Bear Market. I would be prepared to stick my neck out and make that call if the index falls below 1,379 (the 50% mark)
Finally, a few days ago, Richard Russell’s PTI index recently came within 8 points of turning negative. In context of the above, I am prepared to treat that as a warning shot across the market’s bow.
This warning short happened to coincide with the increased volatility on the bond markets as evidenced by the 10 year yield chart below:
Chart #6: US 10 Year Treasury Yield, 3% X 3 box Reversal Point & Figure
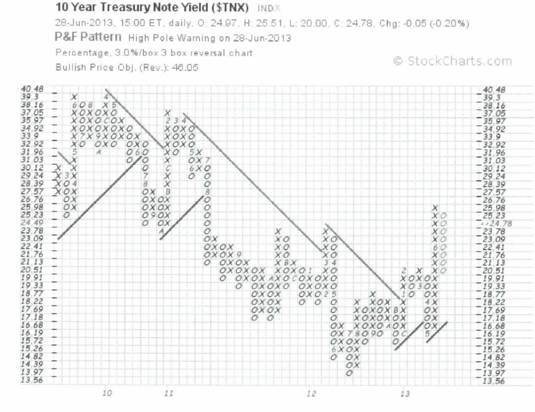
Note how the “high pole” has now reversed itself. In context of all that has been happening, I have to conclude that the latest column of descending zeros has been artificially created by Fed interference. But, at the end of the day, The Fed is not City Hall, the Market is City Hall. City Hall is where the public gathered to take decisions.
Conclusion
To quote Abraham Lincoln: “You can fool some of the people all of the time, and all of the people some of the time, but you cannot fool all of the people all of the time.”
The above series of charts – when seen holistically – leads to the conclusion that we may see growing fear in the markets within the foreseeable future. Investors will likely increasingly come to understand that the Greenspan/Bernanke hosted party is drawing to a close. Rightly or wrongly, gold is perceived as a haven for savings. It’s time to act.
As an optimist, I don’t think we are witnessing the end of the world so much as the culmination of a “me” oriented era of selfishness and corruption and, soon, the dawning of a new and more “we” oriented era.
Author, Beyond Neanderthal and The Last Finesse
Beyond Neanderthal and The Last Finesse are now available to purchase in e-book format, at under US$10 a copy, via almost 60 web based book retailers across the globe. In addition to Kindle, the entertaining, easy-to-read fact based adventure novels may also be downloaded on Kindle for PC, iPhone, iPod Touch, Blackberry, Nook, iPad and Adobe Digital Editions. Together, these two books offer a holistic right brain/left brain view of the current human condition, and of possibilities for a more positive future for humanity.
Copyright © 2013 Brian Bloom - All Rights Reserved
Disclaimer: The above is a matter of opinion provided for general information purposes only and is not intended as investment advice. Information and analysis above are derived from sources and utilising methods believed to be reliable, but we cannot accept responsibility for any losses you may incur as a result of this analysis. Individuals should consult with their personal financial advisors.
Brian Bloom Archive |
© 2005-2022 http://www.MarketOracle.co.uk - The Market Oracle is a FREE Daily Financial Markets Analysis & Forecasting online publication.