


Gold Investors Keep Calm and Carry On
Commodities / Gold and Silver 2013 Jun 25, 2013 - 10:13 AM GMTBy: Frank_Holmes

 Legendary businessman Steve Forbes once said, "Everyone is a disciplined, long-term investor until the market goes down." It's challenging to have the fortitude to hold on to investments during a one-day carnage event like last Thursday. Everywhere you looked there was red on the screen, as U.S. stocks lost 2.5 percent, commodity equities lost 3 percent and gold declined 5 percent. Gold stocks took one of the biggest blows, falling about 7.5 percent.
So what should an investor do after a day like Thursday? Stay calm and invest on, as I believe there is opportunity in picking up what the bears left behind. Here are a few ideas to ponder.
Gold
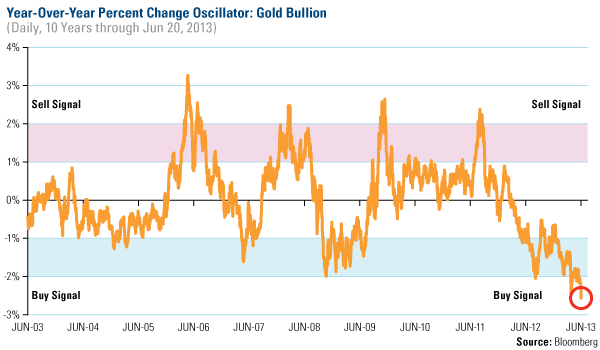
Gold fell below $1,300 on Thursday, and based on our oscillator data, the yellow metal is now in extremely oversold territory. On an annual basis, bullion is down 2.6 standard deviations, which is the worst reading over the past 10 years.
This is the opposite reading that gold buyers had in the summer of 2011, when it was up 2 standard deviations, or at the $1,900 level.
Last week, before this market event occurred, I said that gold could fall another ten percent, but that there could be a 30 percent upside over the next 18 months. You can see the upside potential in the chart, as gold appears due for a reversal toward the mean.
However, short-term financial gold traders may be discouraged from acting on this bullish sign, as the yellow metal is now even more expensive to trade. After last Thursday's huge sell-off, the CME Group, the largest operator of futures exchanges in the U.S., decided to raise margin requirements on gold. As of the close of trading on June 21, the minimum cash deposit for gold futures will increase 25 percent to $8,800 per 100- ounce contract, reports Bloomberg.
This is the second increase in only three months. In April, the CME raised the initial gold margin requirement, which is what triggered the short-term liquidation out of financial gold ETFs and futures.
This isn't a typical move for the CME. Usually, the firm raises margins when prices are rising rapidly to cool down speculation or lowers margin requirements in an attempt to boost liquidity.
In contrast, cash buying of gold is increasing, and this is good news for two reasons: 1) Retail gold investors are not leveraged like futures gold trader, and 2) their buying tends to be stickier.
As we have always suggested, it is prudent to have a 5 to 10 percent exposure and to view gold as a longterm investment. It's important to rebalance annually or when the oscillator shows that gold has moved 2 standard deviations.
Weakness in ETFs Highlights Strength in Mutual Funds
Buyers of ETFs beware, as last Thursday's selling exposed a fundamental weakness in the structure of the exchange traded fund. Unlike a mutual fund, which allows the investor to buy or sell at the daily net asset value, ETFs can trade at a premium or discount to their net asset value (NAV). At any point in time, an investor can overpay for an asset (i.e. premium) or receive less than the asset is worth (i.e. discount).
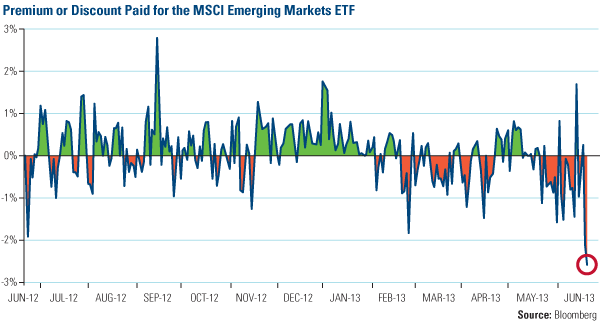
These premiums and discounts can be tremendous on days with big NAV changes, as investors realized Thursday. The chart below shows the NAV trading premiums and discounts for the MSCI Emerging Markets Index ETF (EEM) over the past year. As you can see, the ETF often experienced significant premiums and discounts in this time frame, however, the discount was never as severe as it was last Thursday. As panic selling set in last week, the discount grew to be as much as 2.56 percent. Simply stated, "at the very moment of maximum selling, the ETF exacts the maximum trading cost from the seller (and rewards the buyer similarly, with a discount)," says Brendan Conway from Barron's.
By clicking the link above, you will be directed to a third-party website. U.S. Global Investors does not endorse all information supplied by this website and is not responsible for its content.
He explained the difference in the pricing of the MSCI Emerging Markets Index compared to the underlying ETF. Using data from Morningstar, he writes:
"iShares fund enters Friday's trading session with a closing Thursday market price of $36.88. But the NAV is $37.85. It's about a full dollar higher. View it in total-return percentage terms: EEM's market price was down by 16.4% as of Thursday's close. But the NAV had only lost 13.2%. "
Conway's contrarian lesson for ETF investors: "Don't sell into a panic. ETFs are built to penalize lemmings and reward contrarians."
When it comes to investing, I believe there is no such thing as a free lunch. ETFs have relatively low expense ratios compared with actively managed funds in the same sectors, but that doesn't mean that in the end an ETF costs less to own or that an ETF generates better returns. On volatile days such as last week on Thursday, ETFs can be expensive to trade.
Case Study on a Chemicals Company
Instead of seeking the short-term trade, we prefer to actively look for solid companies that we believe will outperform over a longer period of time. One such promising opportunity currently held in the All American Equity (GBTFX) and Global Resources Funds (PSPFX) is materials company, LyondellBasell (LYB).
Lyondell is one of the world's largest plastics, chemicals and fuels companies, pays a dividend and just announced that it intends to repurchase up to 10 percent of its outstanding shares over a 12-month period.
A "combination of organic cash generation and financial flexibility" could be potentially profitable for its shareholders, as over the next two years, returning "cash to holders of more than 30 percent of Lyondell's equity market capitalization," says Bank of America Merrill Lynch (BofA-ML).
The company is poised to benefit from a recent trend that's been developing in the chemicals sector. In a recent report, BofA-ML reported that ethane will likely be oversupplied for the next three years. This is causing ethane to "trade near 'floor' prices as determined by the value of natural gas over this period." With natural gas currently sitting below $4 per million British Thermal unit (MMBtu), ethane will likely average less than $0.30 per gallon.
Ethane is the raw material that's used in the petrochemical industry, and cheap ethane translates to significantly increased profit margins for U.S. chemical companies, including LyondellBasell.
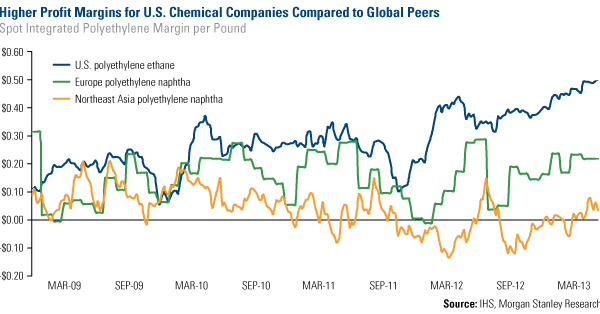
You can see in the chart below that U.S. chemical companies have much higher profit margins compared to their global peers, with profit margins around $0.50 per pound. This compares favorably to the chemical companies in Europe and Northeast Asia, which have current margins at $0.20 and $0.05 per pound, respectively. These companies use what's called polyethylene naphtha, which is polyethylene made from the raw material, naphtha. Naphtha is oil-based, and because oil is much more expensive to natural gas, ethane is a cheaper feedstock.
This is just one example of opportunities you can find in today's market if you keep calm and carry on.
Are you interested in receiving more opinions on gold, natural resources and emerging markets? Sign up to receive email updates from Frank Holmes and the rest of the U.S. Global Investors team, follow us on Twitter or like us on Facebook.
By Frank Holmes
CEO and Chief Investment Officer
U.S. Global Investors
U.S. Global Investors, Inc. is an investment management firm specializing in gold, natural resources, emerging markets and global infrastructure opportunities around the world. The company, headquartered in San Antonio, Texas, manages 13 no-load mutual funds in the U.S. Global Investors fund family, as well as funds for international clients.
All opinions expressed and data provided are subject to change without notice. Some of these opinions may not be appropriate to every investor.
Standard deviation is a measure of the dispersion of a set of data from its mean. The more spread apart the data, the higher the deviation. Standard deviation is also known as historical volatility. All opinions expressed and data provided are subject to change without notice. Some of these opinions may not be appropriate to every investor. The S&P 500 Stock Index is a widely recognized capitalization-weighted index of 500 common stock prices in U.S. companies. The NYSE Arca Gold BUGS (Basket of Unhedged Gold Stocks) Index (HUI) is a modified equal dollar weighted index of companies involved in gold mining. The HUI Index was designed to provide significant exposure to near term movements in gold prices by including companies that do not hedge their gold production beyond 1.5 years. The MSCI Emerging Markets Index is a free float-adjusted market capitalization index that is designed to measure equity market performance in the global emerging markets. The U.S. Trade Weighted Dollar Index provides a general indication of the international value of the U.S. dollar.
Frank Holmes Archive |
© 2005-2022 http://www.MarketOracle.co.uk - The Market Oracle is a FREE Daily Financial Markets Analysis & Forecasting online publication.