


Gold And Silver Greater Certainty is Found in the Charts
Commodities / Gold and Silver 2013 Jun 15, 2013 - 05:06 PM GMTBy: Michael_Noonan

 Opinion: noun 1. A belief or judgment that rests on grounds insufficient to produce complete certainty.
That pretty much sums up what has been proposed and "re-proposed" as to the lofty heights that both gold and silver will/may/should attain. For many, the anticipated higher prices should have already been attained. In fact, over the past several months, many opinions have been "re-proposed" as often as central bankers have re-hypothecated their gold holdings. With all the known information: strong demand,[for the physical], inability to deliver the contracted physical, etc, gold and silver remain at recent lows. Hence, the value of opinions.
While opinions can never be asserted with "complete certainty," there is any absolute certainty about them: they will never go away. Who does not have one? A brief editorial on the above follows, followed by the charts.
Some say their eyes glaze over when confronted with charts. However, there is a high degree of logic within them, so for those with glazed-eye tendencies, maybe the appeal to your logic will help, considerably, when reading our comments on/about them.
We look for certainty in the charts, for they are absolute and the final word at the end of day, week, month, etc. There can be no dispute over a bar's high, low and close, plus the volume, for whatever the time period under consideration. There can be differences of opinion over their interpretation, but establishing a fixed set of parameters can mitigate most any potential dispute.
Little can be added to the ongoing developments, from a fundamental perspective, that has not already been painfully scrutinized and presented. When a change does occur, it always, [or almost always, to stave off picky detractors] shows up in the charts in some form of a change in price/volume behavior.
In defense of charts, and for clarity of purpose, they present nothing more than up to the moment past tense facts in the form of price and volume. They are not predictive in value, contrary to many misconceptions, but they can be helpful to read the market's intent. When one can get a fix on the intent, what is then required is confirmation in order to then act upon the developing information.
If one forms an opinion, based upon a reading of a chart's developing market activity, the opinion can be proven wrong, with the blame being assessed against the "faulty" chart, surely not one's opinion. Alternatively, if one makes a reasoned determination about a market's intent and then waits for confirmation to validate the intent, the odds of being successful increase dramatically.
For many who played the futures market, expecting to score big time on the anticipated sharp increase in gold/silver prices, the losses have been huge over the past 20 months. Opinions can be costly. However, if one had waited for confirmation that prices were in a clear up trend, as opposed the protracted trading range and now down trend, losses would not have occurred or would have been relatively smaller.
Without rules for engaging the markets, opinions do not matter, and blaming charts for the wrong reasons is a refusal to accept responsibility for not using confirming rules. No one can escape from forming an opinion. The difference comes in how it is executed in the marketplace. An "unconfirmed" opinion can be dangerous. Even a confirmed one can still prove wrong, but the circumstances are totally different. To the charts.
We can assert the trend is down because of lower lows and lower highs. June is now just half-way through the month, so not much credence can be placed on the abbreviated information. What can be seen, at this point, is a very small range, so far, following a small range in May that closed poorly.
What we know for certain is that the downtrend has not yet changed, so lower prices can be expected. Whether lower prices develop cannot be known, but it would be a safe bet to not buy into a declining market. We may hold an opinion that gold will ultimately be considerably higher in value, but there is no confirmation that price has begun to rally.
We have repeatedly advocated buying, and personally holding physical gold, but for a different stated purpose, as a measure of insurance and the potential for creating wealth, based upon past history.
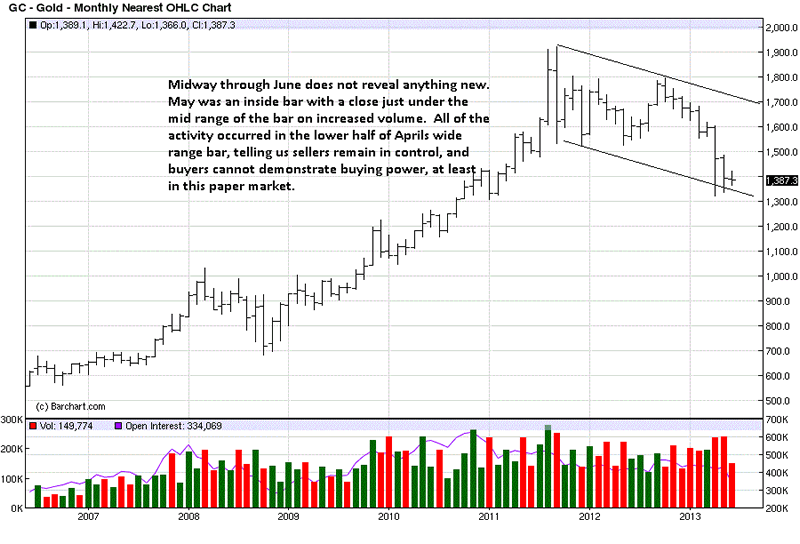
We have stated that wide range bars with closes in the middle tend to contain prices for some time, moving forward. That is an assessment based upon fact from proven market behavior. [See Markets Provide Us The Best Information, click on http://bit.ly/18pk8yE, first 3 gold charts, as examples].
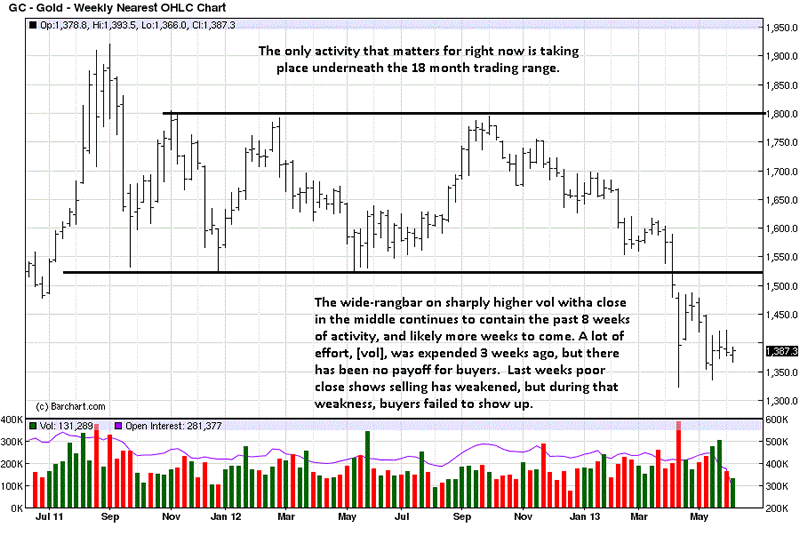
There is insufficient market activity from which to draw a conclusion, at this date. There will be some kind of developing market activity that will alert us to a potential change, and even that will have to be confirmed by subsequent market behavior.
Can this be stopping activity from which price will turn around, or is it a temporary resting area before price resumes the trend lower? We do not know. In fact, no one knows. What we do know is that it does not matter. All we, or anyone, need do is wait for the market to confirm its [advertised] intent, and then follow the market. Too many try to lead the market, based on [ego] opinion[s].
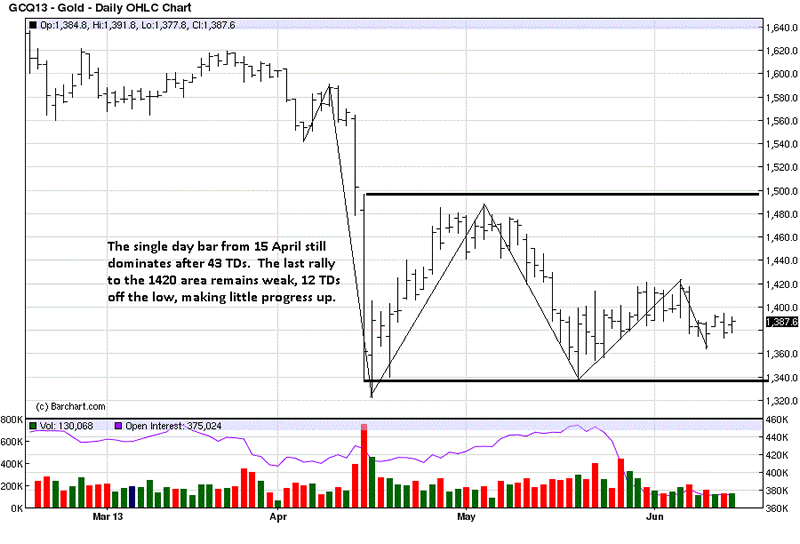
The daily confirms the weekly and monthly, at least in that the[paper] futures market is not going up. There we see the power of a wide range bar containing subsequent price activity, and the last 18 TDs, [Trading Days] show how weak the rally attempts have been.
The chart "story" remains the same: the price of gold is not going up, for now, no matter whose "opinion" you hear/read.
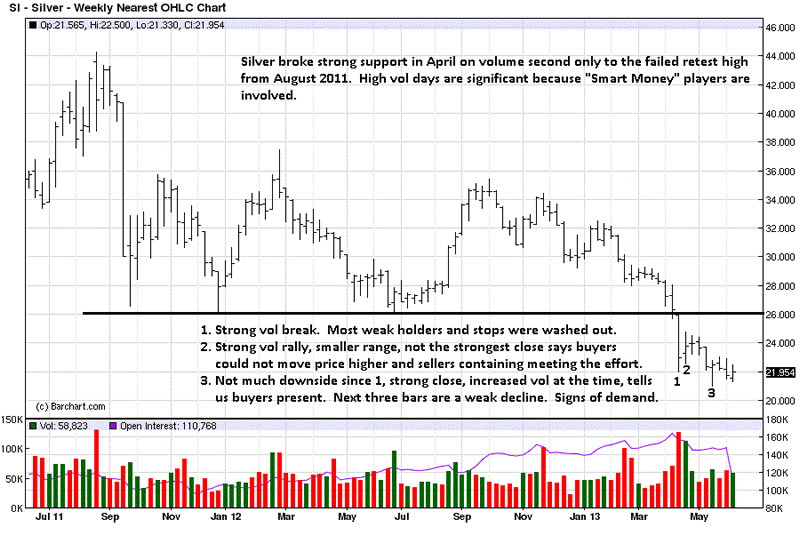
Silver is a bit more interesting, as we suggested last week. Past swing highs can often act as support, and how price reacts to the potential support factor will determine if the high will hold. Right now, the April 2008 swing high has slowed, if not stopped, the decline.
Confirmation of the "opinion" comes from the position of the close 3 months [bars] ago. It was in the middle of the range, telling us buyers were present at the lows, [an example of the logic mentioned earlier], and the following 2 bars have also held. In addition, we are seeing a clustering of closes. What that means is a balance between the forces of supply and demand. From balance comes imbalance, so at some point, we can expect directional movement, up or down, from this area.
The obvious question is posed on the chart: "Where are the sellers?"
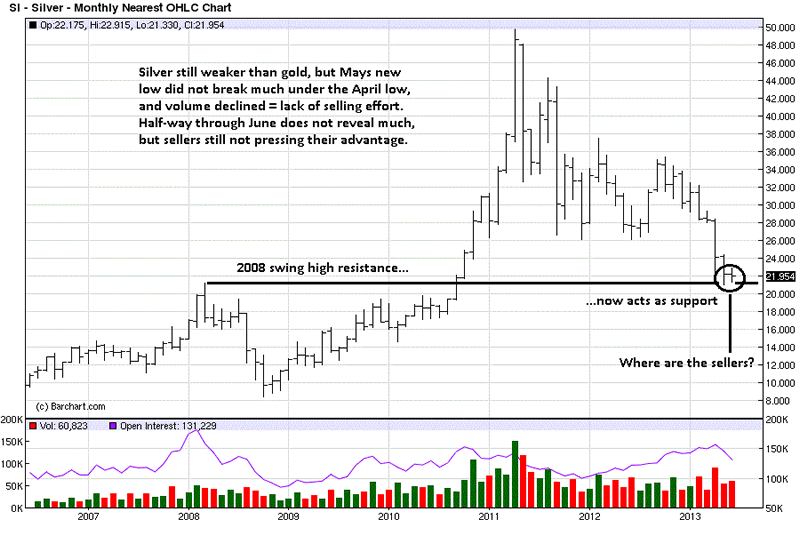
Silver did not hold the wide range down bar in April, as gold did, but in the process of breaking and going lower, it has not gone much lower. The momentum has stopped, and we see that in how some of the bars have formed, [based on factual observations]. More developing price/volume activity is needed to determine the market's intent. For sure, the paper market is not headed higher, at this juncture.
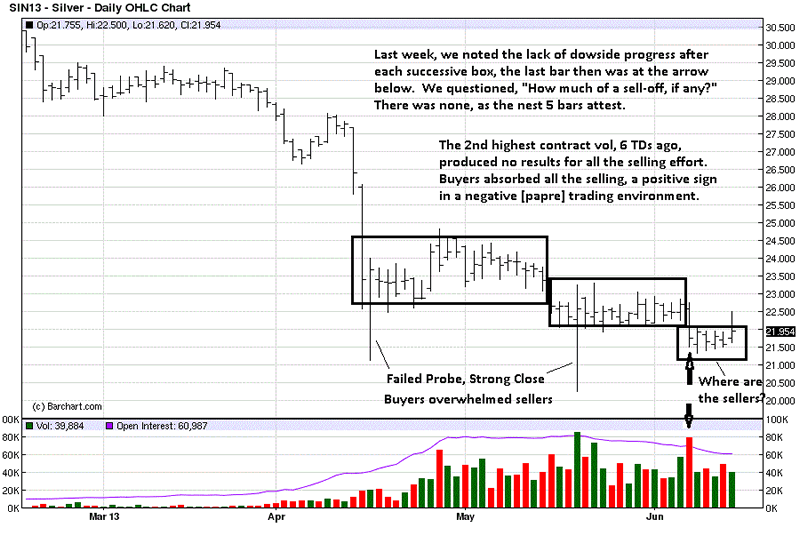
We said silver was more interesting. The two failed probe lower bars are important pieces of information. They are a demonstrated form of buyers supporting the market. Will it hold is the question? [Will that observation be confirmed?]
Additional information helped to give added confirmation to what we posed last week, will it hold? The past 5 trading days say yes, at least for now. That could change next week, with additional information, but next week has not yet happened, so one can only base a decision on what is.
In the previous week and now with last week added, we are seeing a slowing of the downward momentum, [remember the monthly swing high potential support]. Is it enough to stop the decline? It is a question many would like to know, but not important to know, because the market will provide us with confirming market behavior that will then put us in a position to possibly take a position.
If this happens, Then do that. Just like not putting the cart before the horse, one does not "do that" before the If.
What we know for certain, based upon facts presented in the charts as derived from the market, the best source of all, is not to be buying the paper futures market. We covered some of this approach in a different market, the S&P, if anyone wants to learn/read more on the topic of learning to be more successful in trading markets. [See S & P - Trend, Facts, Rules = Successful Trading, http://bit.ly/19efpTs].
By Michael Noonan
Michael Noonan, mn@edgetraderplus.com, is a Chicago-based trader with over 30 years in the business. His sole approach to analysis is derived from developing market pattern behavior, found in the form of Price, Volume, and Time, and it is generated from the best source possible, the market itself.
© 2013 Copyright Michael Noonan - All Rights Reserved Disclaimer: The above is a matter of opinion provided for general information purposes only and is not intended as investment advice. Information and analysis above are derived from sources and utilising methods believed to be reliable, but we cannot accept responsibility for any losses you may incur as a result of this analysis. Individuals should consult with their personal financial advisors.
Michael Noonan Archive |
© 2005-2022 http://www.MarketOracle.co.uk - The Market Oracle is a FREE Daily Financial Markets Analysis & Forecasting online publication.