


Gold Long Wait is Almost Over
Commodities / Gold and Silver 2013 May 30, 2013 - 12:10 PM GMTBy: Peter_Degraaf

 “The American Republic will endure until the day Congress discovers that it can bribe the public with the public's money.” …Alexis de Tocqueville.
The price of gold reached an all-time high of $1925 on September 6th 2011. Since then the price dropped to a low point of $1321 on April 16th 2013. A correction of 45% during a bull market is not unusual; as painful as it is for gold bulls. In the process gold has reached a support line that has held up since the current bull market began. Time is almost up! In the words of W. D. Gann: “When time is up, price will reverse.”
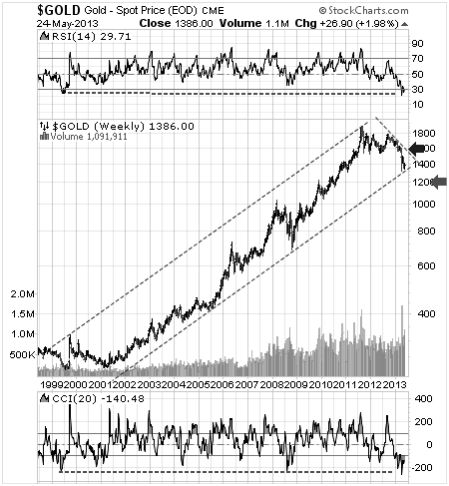
Featured is the weekly gold chart. Price has travelled inside this channel since turning bullish in 2002. The current correction has caused the RSI (top of chart), and CCI (bottom of chart), to return to support levels that have offered support in the past. Since June is often a low point in the yearly gold cycle, there is still a possibility that price could dip to lateral support at the green arrow. The closer we come to the end of June the less likely that this will occur. In the event that it happens, it would simply require a slight widening of the channel. A breakout at the blue arrow turns the trend bullish again.
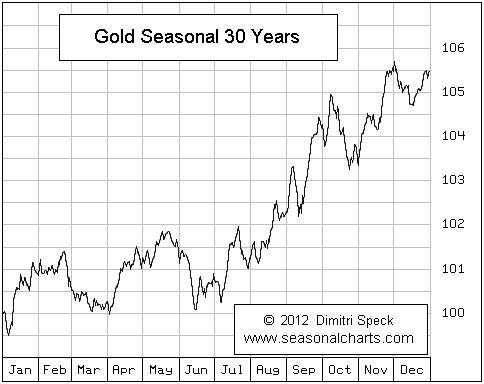
This chart courtesy Seasonalcharts.com shows the tendency for gold to exhibit weakness into June before entering the ‘Christmas rally’. In view of the fact that gold suffered weakness in May (instead of strength) this year, it could well be that the June lows came early in 2013.
It is in the interest of central banks along with the bullion banks that are co-operating, to keep the price of gold as low as possible, to hide the effects of monetary inflation from the public.
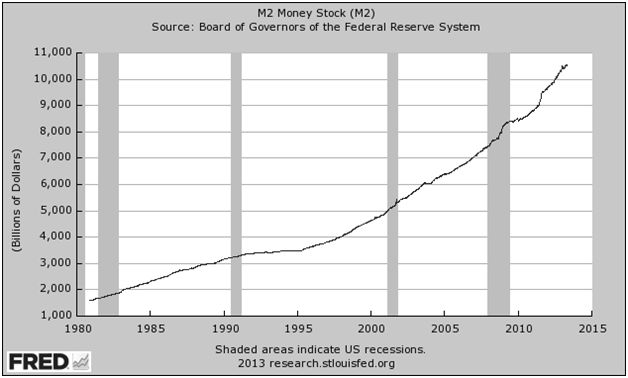
This chart courtesy Federal Reserve Bank of St. Louis shows the M2 money supply is rising without interruption. M2 is now seven times what it was in 1980, when gold was trading at $850.00. This has the potential to drive gold to almost $6,000.00 an ounce without even counting the money that is being printed by other countries. In the history of civilization, there is not one country that escaped the destruction of its fiat currency, once monetary inflation became part of the process.
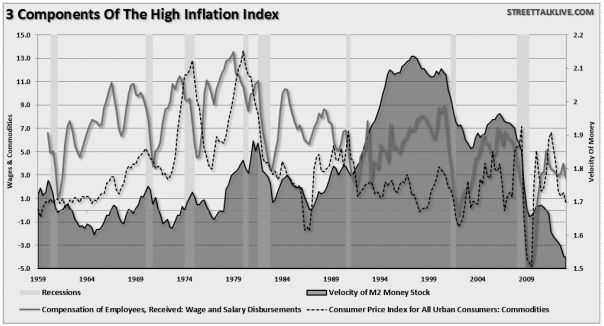
This chart courtesy Zerohedge.com shows the three components of price inflation: Velocity of M2 (blue), Wages (red), and CPI (dotted). Until these three trends turn up we can expect the US FED to continue to add liquidity to the system.
“There can be no other criterion, no other standard than gold.
Yes, gold which never changes, which can be turned into ingots
bars, coins, which has no nationality and which is eternally and
universally accepted as the unalterable fiduciary value par excellence” …..Charles Degaulle
Following are some charts that show the gold price is coiled, ready to spring.
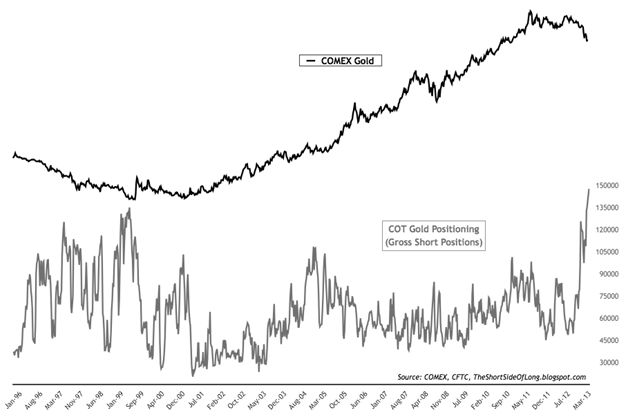
This chart courtesy Shortsideoflong.blogspot.com shows the Price of Gold at the top and the Gross Short Positions of Hedge Funds at the bottom. The number of short positions taken on by hedge funds is at an all-time high. Hedge funds use trend-following trading systems - they follow each other. They’ve all rushed into the same set-up, including add-ons during the past 3 weeks. They’ve taken these positions while the commercial traders (representing the so-called ‘smart money), have reduced their short positions to the lowest levels in several years (next chart).
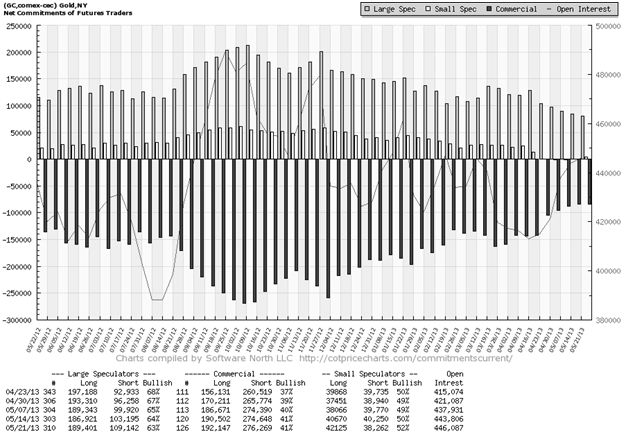
This chart courtesy Cotpricecharts.com shows the ‘net short’ position of commercial gold traders (currently at 84,000), to be at the lowest level since November 2008. Gold was trading at $802.00 back then, just before the rise to $1925.00 The commercials are telling us here that they expect the price to rise soon. As a percentage of the total open interest these net short positions make up just 19%. This is the lowest percentage in many years.
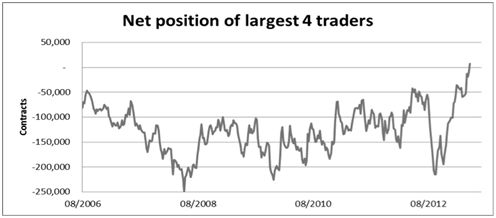
This chart courtesy Alisdair Mcleod shows the 4 largest commercial traders have gone 'net long' in COMEX gold contracts, for the first time since records were kept. This is extremely bullish, as these traders are considered to be the 'smart money'.
Still another sign that gold is ready to turn back up is seen by the number of analysts who are calling for lower prices, or denigrating gold such as Ric Edelman, who prefers to diversify into ‘paper wealth’ instead. The current ‘gold analysts survey’ by Mark Hulbert shows a reading of -35%. This is the lowest reading in years, and from a contrarian point of view this is a very bullish sign.
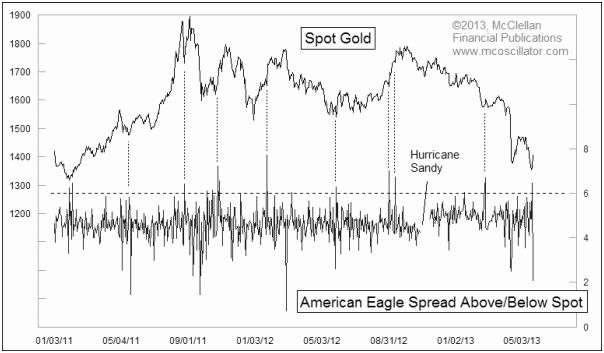
This chart courtesy Mc Clellan Financial Publications shows a correlation between the premium charged for American Gold Eagles at more than 6%, (scale at right side), and the subsequent rise in the price of gold (scale at left).
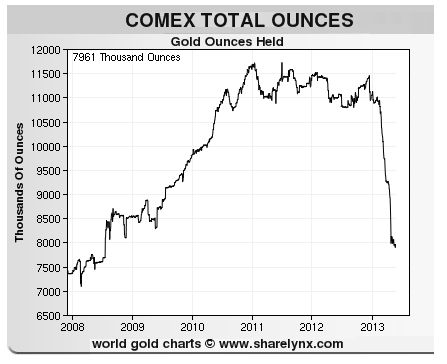
This chart courtesy Sharelynx.com shows the rapid decline in gold for delivery at the COMEX. The bullion is there to back the contracts that are bought and sold, in case the buyer wants to take delivery. If and when the COMEX runs out of gold (or nears that point) the officials in charge will declare 'force majeure' and the price of gold will rise dramatically, just as the Palladium price rose following a 'force majeure' a few years ago.
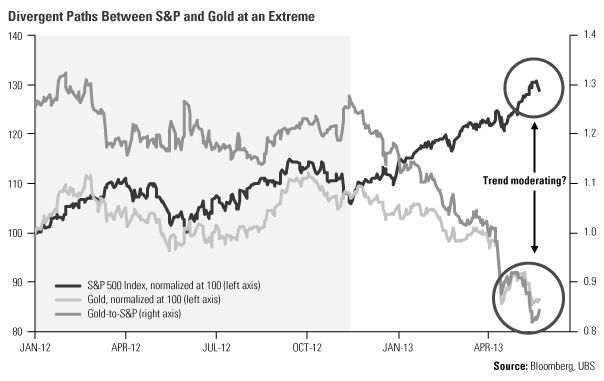
This chart courtesy Bloomberg, UBS, and Frank Holmes, shows the spread between gold and the S&P 500 index has widened considerably and is due to narrow.
The price of silver is also due to turn higher soon.
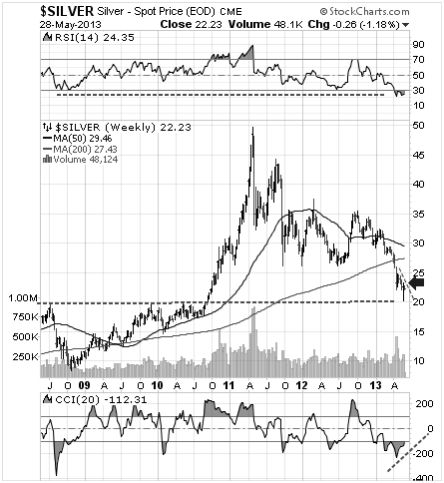
Featured is the weekly silver chart. Price produced an upside reversal after finding support at the lateral support level at 20.00. A close above the blue arrow will confirm the bottom. The two supporting indicators are already rising off support levels.
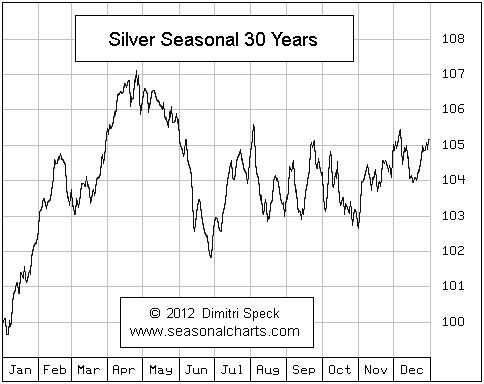
This chart courtesy Seasonalcharts.com shows the seasonal tendency for silver to bottom in June and rise for the remainder of the year and on into spring. In view of the fact that price dropped quite dramatically in April this year, could it be that the June bottom came early this year?
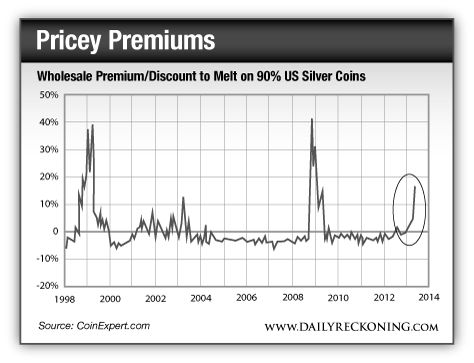
This chart courtesy CoinExpert.com and the Dailyreckoning.com shows the premium on US 'junk silver' coins continues to rise due to strong demand. Historically, whenever the premium on 90% US silver coins rises above 10%, it coincides with a strong rally in the price of silver.
Conclusion: We’ve either seen the bottom in this long correction, or we’re extremely close. Worldwide money printing is ongoing. Unless and until monetary inflation (monetary destruction) turns into price inflation (and it will), the expectation is that the printing presses will continue to produce paper. The longer the stand-off between central banks adding to the money supply, and the gold price being suppressed by bullion banks selling contracts that represent nothing but ‘I-owe-U’s, the higher the price of physical gold and silver will ultimately rise.
Please do your own due diligence. I am not responsible for your trading decisions.
Happy trading!
By Peter Degraaf
Peter Degraaf is an on-line stock trader with over 50 years of investing experience. He issues a weekend report on the markets for his many subscribers. For a sample issue send him an E-mail at itiswell@cogeco.net , or visit his website at www.pdegraaf.com where you will find many long-term charts, as well as an interesting collection of Worthwhile Quotes that make for fascinating reading.
© 2013 Copyright Peter Degraaf - All Rights Reserved
DISCLAIMER: Please do your own due diligence. I am NOT responsible for your trading decisions.
Peter Degraaf Archive |
© 2005-2022 http://www.MarketOracle.co.uk - The Market Oracle is a FREE Daily Financial Markets Analysis & Forecasting online publication.