


Bottoming Gold Should be Bought as Stocks Approach Blow off Top
Commodities / Gold and Silver 2013 May 20, 2013 - 12:25 PM GMTBy: Clive_Maund

 For those of you who are short of time and are accustomed to scrolling down to the bottom of an article to read its conclusions I'm going to save you the trouble by putting the conclusions at the start: the broad US stockmarkets are approaching a parabolic blowoff top and should be sold, and gold and silver are bottoming and should be bought. If you have fallen to the floor laughing at this suggestion it is a sign that you have been brainwashed by The Ministry of Disinformation and you are warned to pull yourself together and take the time to calmly consider the hard facts presented below - otherwise you won't be laughing at all in a few months when YOU will be lying face down in the dirt with tire tracks across your back.
The Barons of Fiat have done an excellent job of discrediting gold and silver and smashing them back down in recent months. They are doubtless crying with laughter at the thought of the distressed 'Little Guy' with his modest hoard of coins and featherweight bars, suffering from depression as a result of their actions and turning negative on the sector. The Little Guy's noble effort to support gold and silver prices by buying a few coins is no match for Big Money's financial chicanery on the paper market, and when push comes to shove, as happened a month ago, the dumping of a couple of truckloads of gold bars onto the market.
For the Barons of Fiat continually rising gold and silver prices are an embarrassment and may cause people to seriously question the entire fiat system. They don't want that of course, hence the recent organized takedown, which Big Money even profited from handsomely, by first going short big time, and then getting the media, which they control, to run stories discrediting gold and silver. So it's nice of Goldman Sachs to tell us that they have now covered their gold short position at a handsome profit.
The underlying drivers for the gold and silver bullmarket remain in place of course, which are unrestrained global money supply growth and credit growth, which are fuelling big inflation in various countries, even if this is disguised by massaged government statistics. This implies that the recent gold and silver takedown is throwing up a major buying opportunity, even if the basing phase continues for a while longer. So let's now move on to see what the latest charts for gold, and for its COTs and various sentiment indicators are telling us about the internal dynamics of the sector at this point.
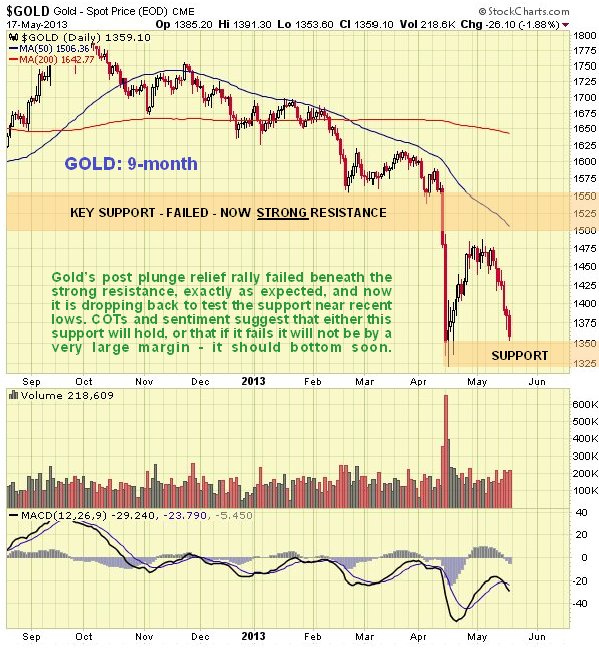
In the last update, posted on 28th April, we stated that gold's relief rally had peaked and that it would turn back down and retreat back towards it April panic lows. The David vs Goliath stories about widespread buying of physical gold around the world enabled Big Money to squeeze a little more blood out of the Little Guy, who jumped back in prematurely, just as we expected. On the latest 9-month gold chart we can see that gold has now reacted back towards its April panic lows as predicted, and our challenge now is to determine whether it will continue to drop to substantially lower levels or whether it will turn up here, or soon, and in our quest we will be greatly assisted by pertinent data on the current COT structure and various sentiment indicators.
Before going further it is worth highlighting the fact that gold is now one of the most hated asset classes in the world, and Big Money's media henchmen are not wasting any opportunity to put the boot into it, oblivious to the irony that such negativity is music to the ears of the true contrarian, which we like to think includes us. The relentless and brutal attacks on gold in the mainstream media are a sure sign that we are at or near to an important bottom.
Returning to consideration of the 9-month chart we see that gold has dropped back quite hard, but in a fairly steady manner, over the past week or so towards its April panic lows. This alone implies that there is a fair chance that the support at these lows will hold, or that if it is breached, it won't be by much. As we will soon see, COTs and sentiment indicators strongly suggest that gold is now in a basing process, and that if it does drop further, it won't be by much.
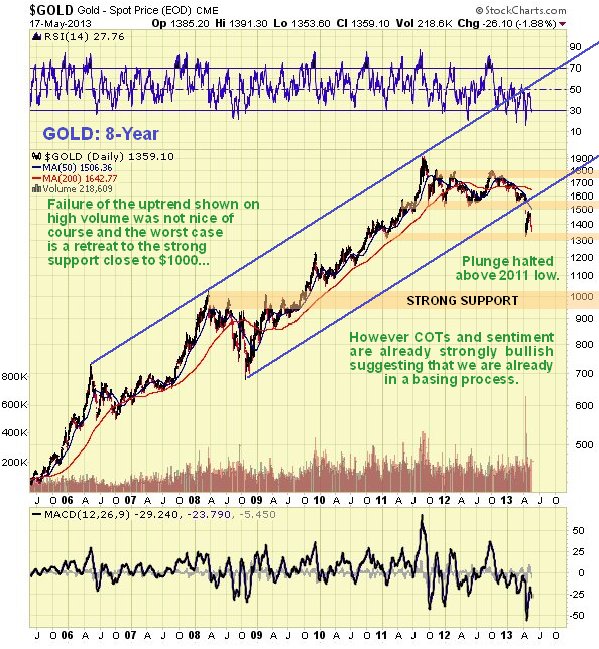
While gold admittedly doesn't look too good on its 8-year chart, as the high volume breakdown from the top area implies that it could drop further towards strong support approaching $1000, this outcome does not look likely given the COT and sentiment extremes that we are already seeing, and the explosion of negativity towards the metal in the mainstream media, all of which are indicating that we are at or close to a major bottom NOW.
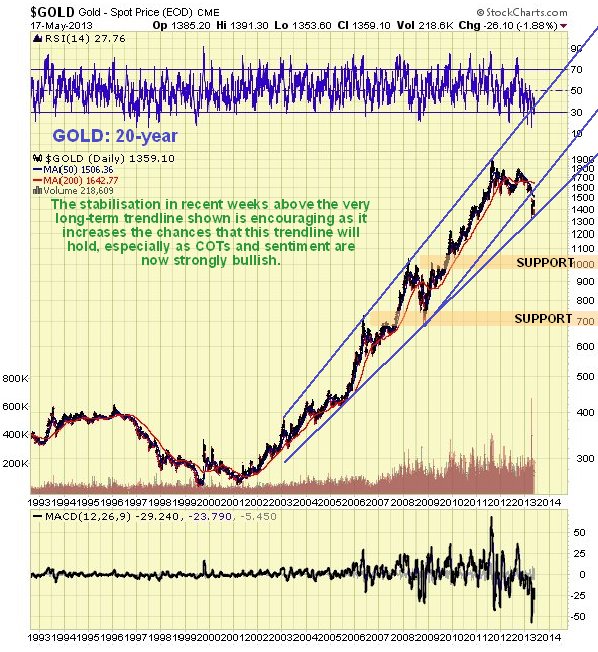
It thus looks likely that gold will turn higher from, or near to, the supporting long-term uptrend line shown on its 20-year chart below.
Having reviewed the gold price charts let's now consider its latest COT and sentiment charts, starting with the COTs.
The COT chart below shows that Commercial short and Large Spec long positions have dropped to their lowest level by far for the life of this chart. This is bullish. Small Specs are out completely, which is another positive sign.
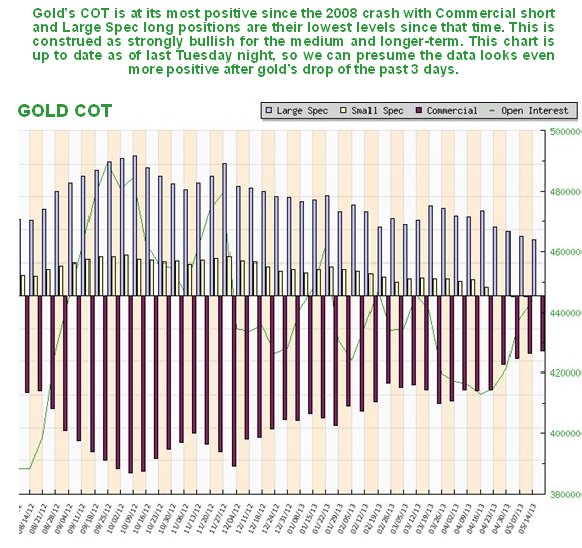
The COT chart below, which goes back to 2006, reveals that Commercial short and Large Spec long positions are at their lowest levels since the 2008 crash. Small Spec long positions have collapsed to almost nothing. This is all very bullish for gold over a medium and long-term time horizon.
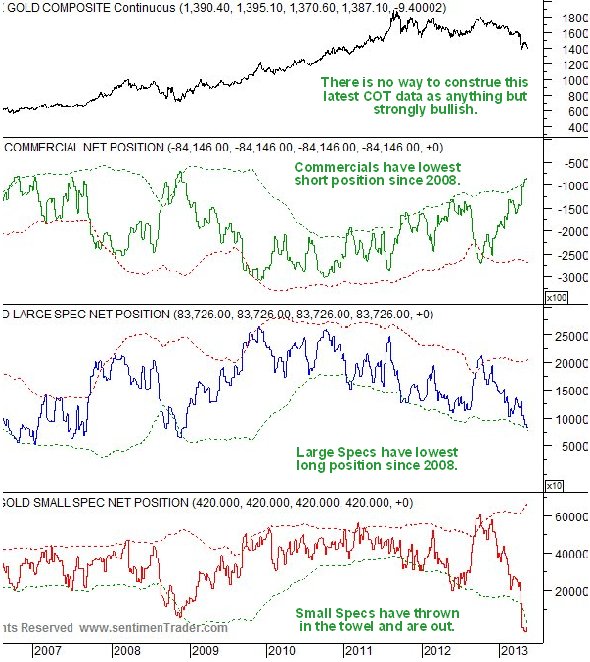
Chart courtesy of www.sentimentrader.com
Hulbert Gold Sentiment is at its lowest reading for years. This is a contrarian indicator that is strongly bullish.
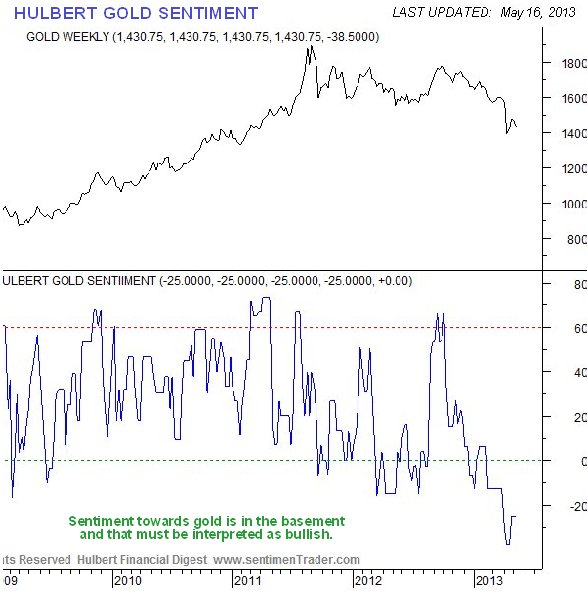
Chart courtesy of www.sentimentrader.com
The Public Opinion chart for gold below shows that bullishness towards gold is at its lowest level for years, which is another contrarian bullish indication.
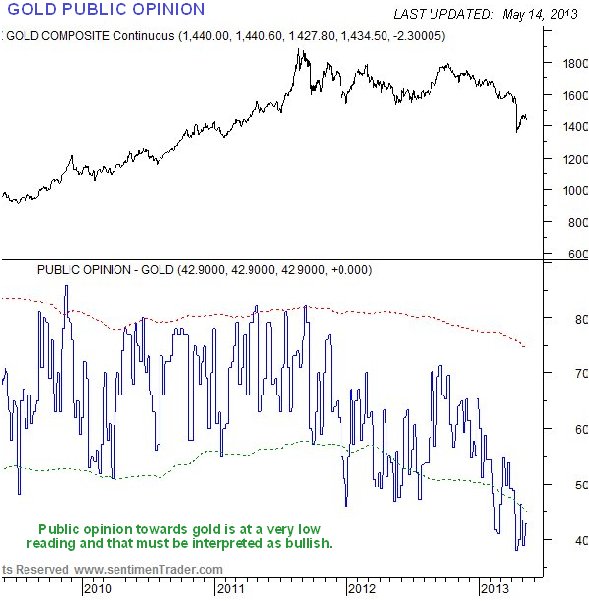
Chart courtesy of www.sentimentrader.com
The Rydex Fund traders, who are renowned for their incompetence, also furnish us with still more proof that gold is at or close to a major low, as the chart for their holdings below shows their Precious Metals assets at a very low level.
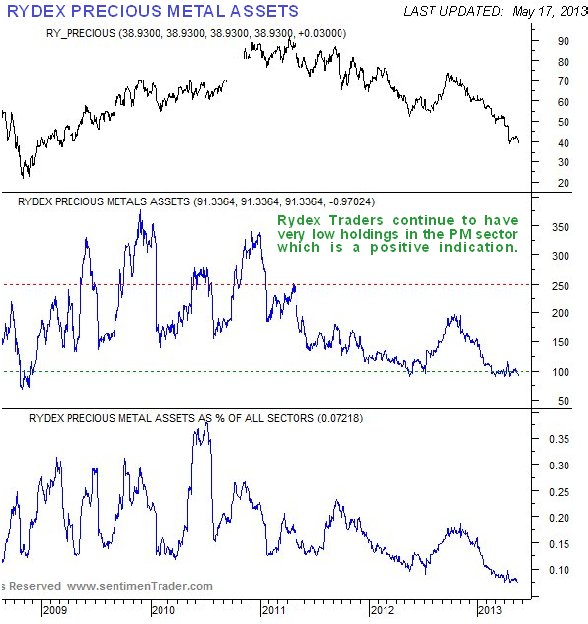
Chart courtesy of www.sentimentrader.com
One reason for gold going into the dumpster over the past week or so has been the strength in the dollar. As we can see on the latest 6-month chart for the dollar below, it has broken out upside from its recent Dome formation and gone on a tear, but it is now overbought.
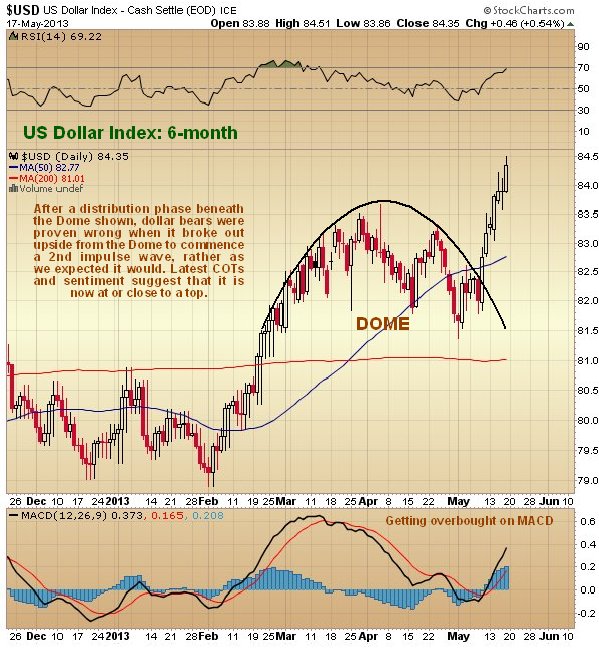
We had expected this upside breakout from the Dome so it came as no surprise, and last week interpreted this move on the site as being a 2nd impulse wave. However, judging from the latest COTs and sentiment for the dollar, we may be being too generous in this interpretation, as indicators suggest that it is getting close to, or may even be at, a top.
The dollar's latest COT chart shows that the Commercials now have a substantial short position, and the Large Specs a substantial long position in the dollar, while the Small Specs are record long the dollar, for recent years anyway, and this is viewed as a fairly sure sign that we are at, or close to, a top.
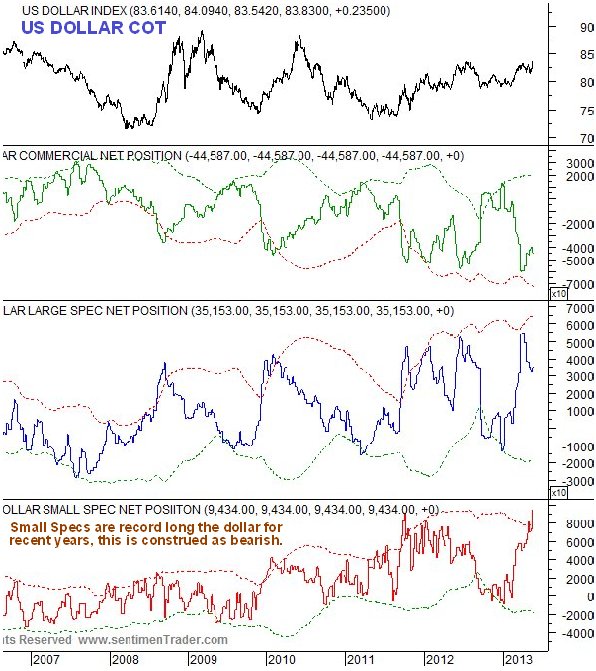
Chart courtesy of www.sentimentrader.com
Meanwhile Public Opinion on the dollar is close to its normal upside limit, also making it highly likely that the dollar will top out soon.
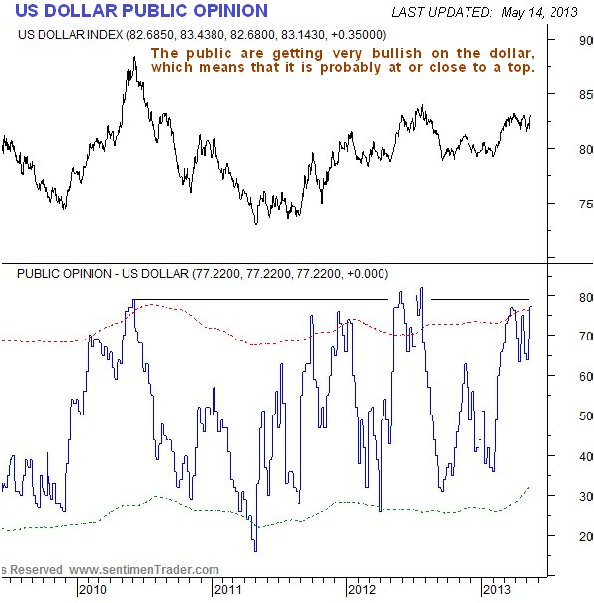
Chart courtesy of www.sentimentrader.com
Needless to say, if the dollar tops out shortly, gold and silver are likely to take off higher again, and now we are a good point for them to do so.
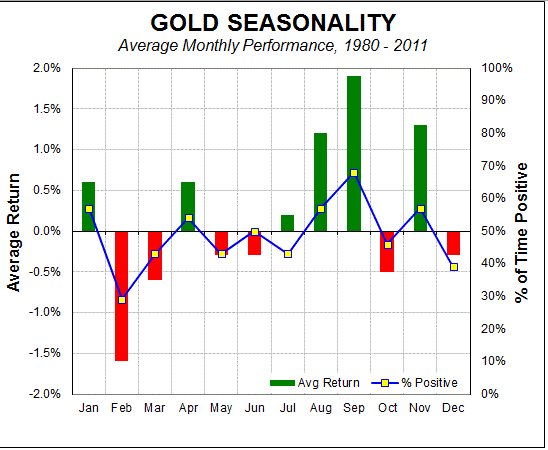
Now, we are aware that if the parabolic acceleration in the broad market intensifies short-term, gold could remain depressed and perhaps drop some more, and this fits with gold's seasonals. The seasonal chart below shows that gold is seasonally weak in May and June, but starts to perk up in July before entering its seasonally strongest time of the year in August and September. So the base building process in gold may continue for a while yet, during which gold and gold ETFs may be accumulated on weakness.
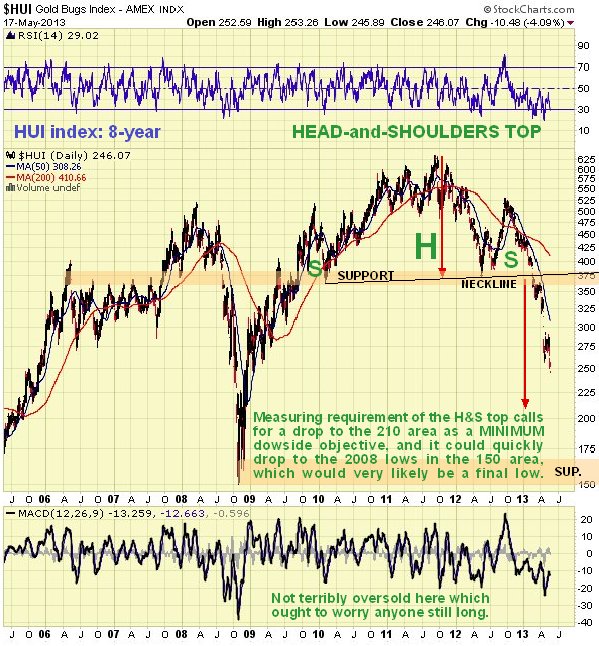
While gold and silver are thought to be in a bottoming out process, the same cannot yet be said for PM stocks, which are still in freefall, and likely to drop further if gold and silver continue to base for a while, perhaps dropping a little more in the process. On its 8-month chart we can see that the HUI index still looks terrible despite its recent huge losses. Having broken down from a large Head-and-Shoulders top this index plunged and the minimum measuring requirement for the pattern calls for a drop to the 210 area, and it is considered quite likely that in the final stage of the decline it could plunge quickly back to the vicinity of the 2008 lows in the 150 area, where, depending on how things look at the time, it may be in order to aggressively, but selectively, buy the sector. The terrible appearance of this chart, and the lack of any basing action to date has deterred us from buying the sector in recent weeks, despite it obviously being oversold and relatively cheap.
The following stunning chart from www.sentimentrader.com shows that Small Speculators are more than completely out of the Precious Metals sector - they are shorting it for the first time ever. While this does not mean that it won't drop further over the short to medium-term, it certainly puts us on notice to look out for the final bottom soon.
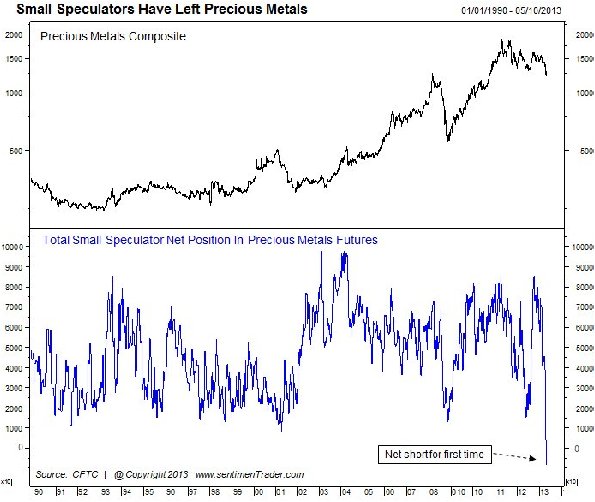
Chart courtesy of www.sentimentrader.com
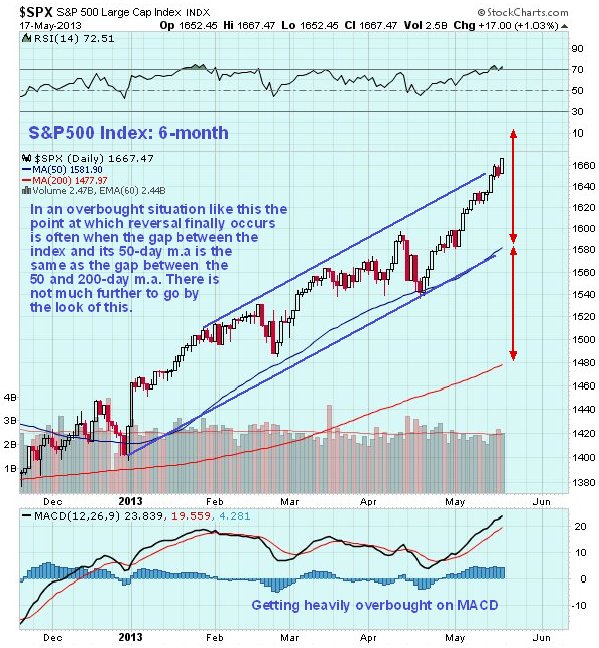
How far might the parabolic blowoff move in the broad stockmarket run before it burns out? A generally useful guide is that it is likely to top out when the S&P500 index runs as far ahead of its 50-day moving average as its 50-day moving average is ahead of the 200-day moving average. If this is what happens it clearly has some way to go yet before it peaks. If it does this we will be ready.
As we can see from the following, which relates to the broad US stockmarket, the fools are certainly getting worked up at this time, while Smart Money is scaling back its holdings!
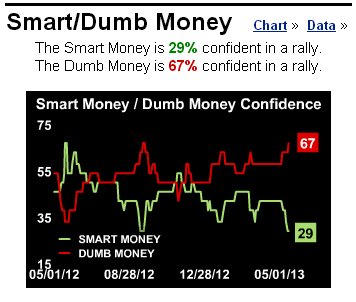
Chart courtesy of www.sentimentrader.com
The conclusion of this article is set out in the opening paragraph, which will surely be appreciated by the true contrarians amongst you.
We will shortly be examining the broad US stockmarket on the site in some detail, with reference to various technical indicators, in an article which will be simply and succinctly titled "FOOLS!!!!"
By Clive Maund
CliveMaund.com
For billing & subscription questions: subscriptions@clivemaund.com
© 2013 Clive Maund - The above represents the opinion and analysis of Mr. Maund, based on data available to him, at the time of writing. Mr. Maunds opinions are his own, and are not a recommendation or an offer to buy or sell securities. No responsibility can be accepted for losses that may result as a consequence of trading on the basis of this analysis.
Mr. Maund is an independent analyst who receives no compensation of any kind from any groups, individuals or corporations mentioned in his reports. As trading and investing in any financial markets may involve serious risk of loss, Mr. Maund recommends that you consult with a qualified investment advisor, one licensed by appropriate regulatory agencies in your legal jurisdiction and do your own due diligence and research when making any kind of a transaction with financial ramifications.
Clive Maund Archive |
© 2005-2022 http://www.MarketOracle.co.uk - The Market Oracle is a FREE Daily Financial Markets Analysis & Forecasting online publication.