


Controlling the Beginning Stages of Hyperinflation by Manipulating the Gold and Silver Prices
Commodities / Gold and Silver 2013 May 16, 2013 - 05:27 PM GMTBy: Steve_St_Angelo

 The tactic by the Fed and Central Banks is to inflate the stock markets while manipulating the price of gold and silver lower. This achieves two goals, 1) it reassures the public’s faith by pumping up stock prices while the economic indicators continue to deteriorate and 2) it elevates the dollar while it destroys market sentiment in the precious metals.
So far, the strategy has worked. Some of the toughest gold and silver bugs are becoming extremely frustrated and downright bearish. You can’t blame them as this is typical human psychology. Although, extremes and manipulations never last forever and at some point in time they reverse.
If we look at the next series of charts, we can see just how extreme the gold & silver markets have become. In typical inflation-hyperinflations, stock and commodity asset prices rise together. However, since the Fed announcement of Q3, only certain asset classes have risen — mainly stocks, real estate and to a lesser extent, bonds.
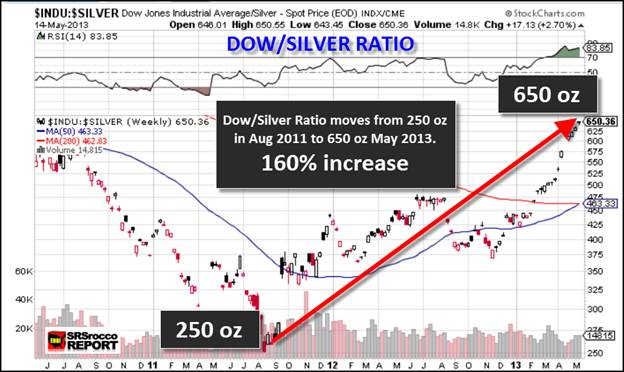
In August of 2011, you could buy 250 oz of silver for the Dow Jones Average, however today, it takes over 650 oz of silver to purchase the Dow – an amazing 160% increase. Furthermore, you can see just how extreme the Relative Strength Index has become.
Let me clarify my position on Technical Analysis. Most of those who read my work, know that I have stated that technical analysis is meaningless in a rigged market. I truly believe this to be true as it pertains to forecasting short-term moves in the prices of gold and silver. On-the-other-hand, using charts to show trends and extreme patterns is useful.
The disconnect of silver after QE3 really takes place around Nov 2012, when the Dow-Silver ratio had fallen to 375 oz. This is the same for gold below:
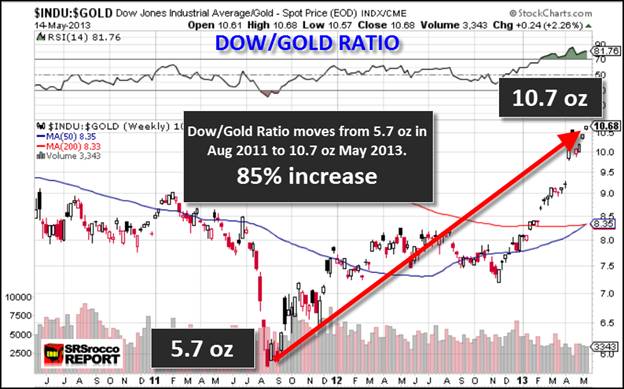
In this chart we can see when the price of gold peaked at $1,900 an ounce, you could buy 5.7 oz of the yellow metal for the Dow Jones Average. Today it takes 10.7 oz of gold (85% increase) to equal the value of the Dow. As I mentioned above in the case of silver, if you look at chart in Nov 2012, you will see how the Dow-Gold ratio fell to approximately 7.2 oz. Both gold and silver disconnected from the Fed’s inflationary program at the very same time.
Even though Dow-silver ratio has nearly declined twice as much as the Dow-gold ratio, the HUI index has suffered much worse:
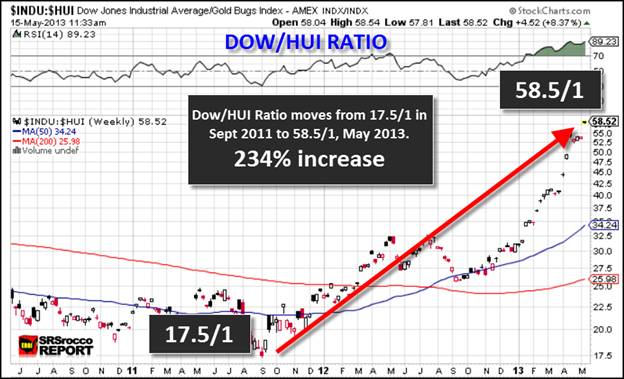
Here we can see that in Sept of 2011, you could have bought 17.5 shares of the HUI compared to the Dow Jones Average, but it takes an amazing 58.5 shares today. Thus, the Dow-HUI ratio wins the extreme trend award by losing 234% of its Sept 2011 value compared to the Dow in less than two years.
Anytime there is an extreme trend in a stock or commodity, it always reverses. We cannot give a date when the trend will reverse as many using technical analysis have tried and failed, but we can safely say... it's just a matter of time.
Precious metal sentiment is not only in the toilet, its down all the way in the cesspool. Again, the Fed and Central Bank policy is working as expected presently. They have deluding the public into believing their 401ks, pension plans, stocks and etc are safe investments in a deteriorating economy, while at the same time destroying the faith in owning gold and silver.
I would like to remind the reader, all bear markets follow the same trend. At the top of the market there is huge volume of buying, but when the bubble bursts and the market declines, volume disappears.
However in this supposed MSM touted gold and silver bear market, the opposite is taking place. As William Kaye spoke about this in his interview on KWN, when the price of gold and silver were taken down, physical buying in the Asian countries increased 4-5 times. How can buying increase in a bear market? It can in a disconnected manipulated market.
Many frustrated gold and silver investors today are searching for any articles or information that validates holding onto their precious metal investments. This is the simple rule of thumb -- if you feel euphoric, it's time to sell, and if you feel sick to your stomach it's time to buy.
Lastly, the fundamentals for the precious metals are better than ever even though it is not reflected in the paper price. The most important aspect in understanding the true value of gold and silver is their ability to be STORES OF TRADE-ABLE ENERGY VALUE.
More on this in upcoming articles including analysis on the estimated break-even price in the gold and silver industry as well as much more interesting information which you will be able to find at the SRSrocco Report.
© 2013 Copyright Steve St .Angelo - All Rights Reserved Disclaimer: The above is a matter of opinion provided for general information purposes only and is not intended as investment advice. Information and analysis above are derived from sources and utilising methods believed to be reliable, but we cannot accept responsibility for any losses you may incur as a result of this analysis. Individuals should consult with their personal financial advisors.
© 2005-2022 http://www.MarketOracle.co.uk - The Market Oracle is a FREE Daily Financial Markets Analysis & Forecasting online publication.