


Why the Stock Market is Actually Nowhere Near an All-Time High
Stock-Markets / Stock Markets 2013 May 09, 2013 - 12:26 PM GMTBy: Money_Morning

 David Zeiler writes: Celebrations of the S&P 500's recent string of all-time high closes have been premature, as it turns out.
Yes, the Standard & Poor's 500 index set another nominal record today (Tuesday) with a close of 1,625.96.
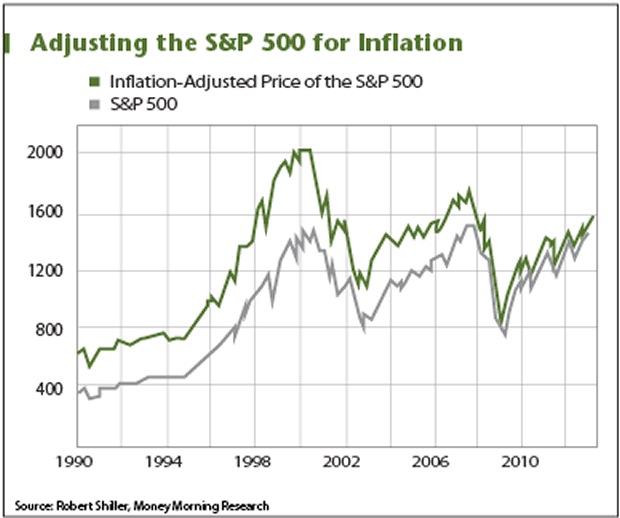
But that doesn't account for inflation. If you apply Yale Professor Robert Shiller's CAPE ratio, the S&P 500's all-time high was somewhere north of 2,000 back in the year 2000 - some 24% below today's record close.
While that might sound like great news for Wall Street's bulls, Shiller's data - which has proven strikingly accurate at predicting long-term market trends - isn't nearly so optimistic about where the markets are headed over the next decade.
Real S&P 500 All-Time High May Be a Long Way Off
Shiller created his CAPE ratio - which stands for "cyclically adjusted price/earnings ratio" - for the book "Irrational Exuberance," which he co-wrote with Harvard economist John Campbell and published in 2000.
Shiller's name might seem familiar for another reason - he also helped create the much-cited Case-Shiller Home Price index.
His goal with CAPE was to iron out distortions caused by corporate earnings cycles by taking the current S&P 500 price and dividing it by the inflation-adjusted average earnings of the index's component companies over the previous decade.
The CAPE measure can help investors determine whether the current S&P 500 is overvalued or undervalued, but more importantly has pointed to where markets are going next.
The all-time high for CAPE was 44.2, reached in late 1999 at the height of the dot-com bubble. That was far above the long-term average P/E for the S&P 500 of about 16.5. The years that followed brought the markets back to Earth, and it would take until 2007 for the S&P to regain the lost ground.
The CAPE index fell to 13.3 in March 2009, when the markets bottomed during the fallout from the 2008 financial crisis.
That was nowhere near the lows of previous downturns, however. The CAPE fell below 7 in 1982 and actually dipped below 5 in 1921. But all three instances of below-average CAPEs were followed by protracted market rebounds.
The current CAPE reading is 23.3 - not in the stratosphere, but significantly above the long-term average. That means the market may still have room to run, but at the very least, the big gains of recent years are coming to an end.
"Right now the CAPE is predicting a real return of something like plus-3% for the next 10 years," Shiller told the Daily Ticker last week.
So while the CAPE isn't predicting another crash, market gains in the years ahead figure to be modest at best.
What CAPE is Telling Investors
Some fans of the CAPE have actually found more to worry about in the data than the man who created it.
For example, Doug Short of Advisor Perspectives looked at CAPE data during periods when it was above 20 while U.S. Treasury bonds were at 2% or lower - as they are now.
"The closest we ever came to this in U.S. history was a seven-month period from October 1936 to April 1937," Short writes on his website, noting that 10-year yields then were 65 basis points higher than they are now.
Short said that after hitting an interim high in February 1937, the S&P 500 dove 44.9% over the next 15 months.
"We're in uncharted territory," Short said.
Meanwhile, critics of Shiller's CAPE index say it's outmoded in today's environment of record-high profits, record-high profit margins and all-time S&P highs.
Shiller admitted that while it could indeed be "different this time" - the mantra that seems to precede the collapse of every bubble - he believes what his data tells him.
He pointed out that a big chunk of recent corporate profit increases have resulted from cost-cutting and reducing long-term investment - actions that eventually will negatively impact bottom lines.
These kinds of earnings fluctuations were one of the reasons Shiller originally created the CAPE; he wanted to make it easier for investors to find value in confusing and often contradictory markets.
"You can think of an array of reasons why it might be true that we're entering a great period for stock price improvement, but in reality value investing is about trusting the ratios and averages," Shiller told The Daily Ticker. "It has survived as an investment tactic for the better part of a century and I'm not ready to abandon it."
Source :http://moneymorning.com/2013/05/07/why-the-sp-500-is-actually-nowhere-near-an-all-time-high/
Money Morning/The Money Map Report
©2013 Monument Street Publishing. All Rights Reserved. Protected by copyright laws of the United States and international treaties. Any reproduction, copying, or redistribution (electronic or otherwise, including on the world wide web), of content from this website, in whole or in part, is strictly prohibited without the express written permission of Monument Street Publishing. 105 West Monument Street, Baltimore MD 21201, Email: customerservice@moneymorning.com
Disclaimer: Nothing published by Money Morning should be considered personalized investment advice. Although our employees may answer your general customer service questions, they are not licensed under securities laws to address your particular investment situation. No communication by our employees to you should be deemed as personalized investent advice. We expressly forbid our writers from having a financial interest in any security recommended to our readers. All of our employees and agents must wait 24 hours after on-line publication, or after the mailing of printed-only publication prior to following an initial recommendation. Any investments recommended by Money Morning should be made only after consulting with your investment advisor and only after reviewing the prospectus or financial statements of the company.
Money Morning Archive |
© 2005-2022 http://www.MarketOracle.co.uk - The Market Oracle is a FREE Daily Financial Markets Analysis & Forecasting online publication.