


How the Fed Creates Stocks Bull and Bear Markets
Stock-Markets / Liquidity Bubble May 02, 2013 - 08:28 AM GMTBy: Clif_Droke

 Bull and bear markets don't just happen - they're created by the Federal Reserve. While few investors dispute the power that Fed interest rate policy has on the market, the extent to which it influences the direction of stock prices in both directions is often downplayed. Moreover, the health of the economy is often decided by the Fed's interest rate policy.
While it's no secret that loose monetary policy on the Fed's part benefits stocks and can lead to credit bubbles, researchers tend to underestimate the effect tight money policy has in creating market crashes and economic recessions. Restrictive money policy on the Fed's part has frequently led to falling stock prices. The extent and duration of the monetary tightness is what determines the severity of the bear market. The longer the Fed restricts money, the more severe the downturn will be.
Consider the bear market of 1973-74. The Dow Jones Industrial Average experienced a decline of 40 percent, which at the time was the worst bear market since the Great Depression. The Dow peaked in early 1973 at an all-time high of 1150 before commencing a Chinese water torture type decline for the next two years. The decline was precipitated by tight money on the part of the Fed, which began raising interest rates in early 1972.
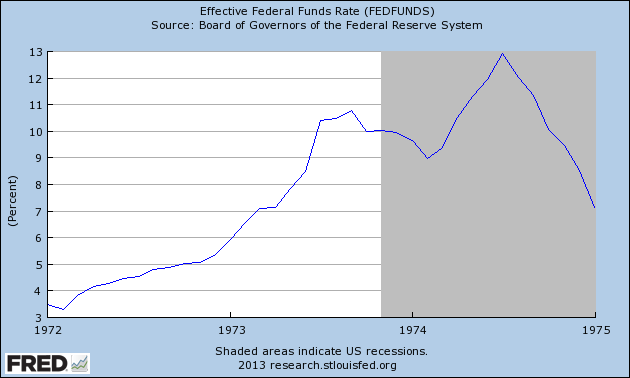
It wasn't until mid 1974 that the Fed began lowering rates and loosening money. Although it took about six months to have the desired effect, by 1975 the Dow launched a recovery rally which by early 1976 had completely retraced the decline of 1973-74.
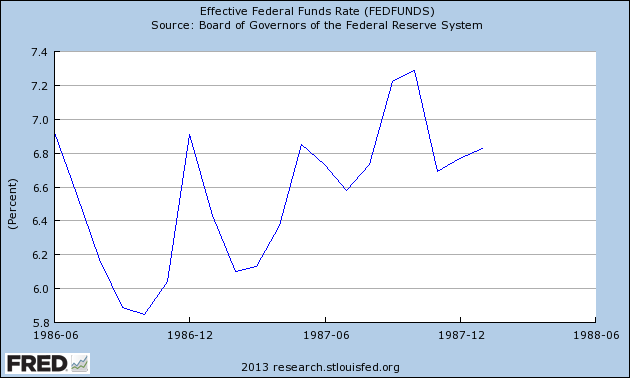
The next major crash was of course the October 1987 stock market crash which witnessed a 1-day drop of 22% in the Dow. Not surprisingly, the October '87 crash was preceded by a rising fed funds interest rate in the year prior to the crash. The effective rate rose from approximately 5.8 percent a year before the crash to around 7.3 percent at the time of the crash.
By far the most egregious example of the Fed abusing its power to engineer a financial debacle occurred in the period between 2004 and 2007. This was the 3-year period that transitioned into the credit crisis of 2007-2009. The Federal Reserve under the chairmanship of Alan Greenspan raised the interest rate from 1 percent in 2004 to just over 5 percent in 2006. Rates were then left at this level for another year before being reduced. By that time, however, the damage had been done and it was too little, too late.
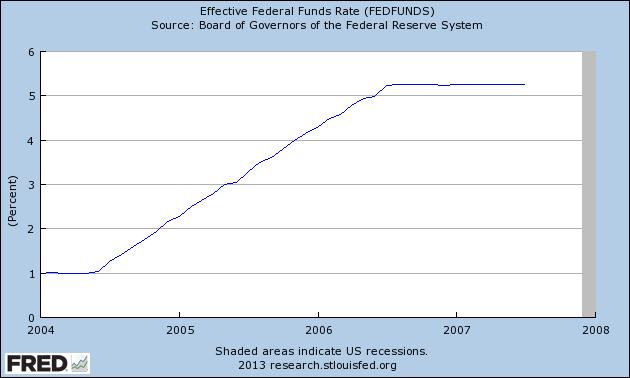
The interest rate hike of 2004-2006 could not have occurred at a worse time, for the financial market and the economy of those years were predicated on a real estate boom that was dependent on low interest rates. By raising the fed funds rate as many times as he did, Greenspan essentially sealed the doom of the U.S. economy and stock market.
There are some economists who overestimate the effect of loose money and credit in creating market crashes. While they correctly identify loose monetary policy as a prime contributor to a financial market bubble, they ignore the devastating impact of a subsequent tight money policy. Loose money doesn't cause a market crash by itself; it's the combination of loose money followed by tight money and credit conditions which serves as the catalyst for a crash.
There is an "X-factor" to all of this, however. While there is no sign of monetary policy tightness on the Fed's part, there is what might be called "policy tightness" by the world's leading governments, including the U.S. Congress. Fiscal austerity current reigns supreme among U.S. and European governments and it could eventually prove detrimental to the Fed's efforts at continuously flooding the system with liquidity. As Dr. Scott Brown of Raymond James has said, fiscal tightness amounts to a "self-inflicted restraint on growth" and that amounts to "very bad economic policy." It also explains why, despite record levels of liquidity, the economy has been able only to tread water in recent years while financial markets have soared to new heights.
Could it be that austerity will ultimately prove to be the catalyst that kills the recovery? The question remains unanswered but with the downward pressure exerted by next year's 120-year Kress cycle bottom, a failure of Congress and other governments to admit that austerity has been a failure could prove fatal.
2014: America's Date With Destiny
Take a journey into the future with me as we discover what the future may unfold in the fateful period leading up to - and following - the 120-year cycle bottom in late 2014.
Picking up where I left off in my previous work, The Stock Market Cycles, I expand on the Kress cycle narrative and explain how the 120-year Mega cycle influences the market, the economy and other aspects of American life and culture. My latest book, 2014: America's Date With Destiny, examines the most vital issues facing America and the global economy in the 2-3 years ahead.
The new book explains that the credit crisis of 2008 was merely the prelude in an intensifying global credit storm. If the basis for my prediction continue true to form - namely the long-term Kress cycles - the worst part of the crisis lies ahead in the year 2014. The book is now available for sale at: http://www.clifdroke.com/books/destiny.html
Order today to receive your autographed copy and a FREE 1-month trial subscription to the Gold & Silver Stock Report newsletter.
By Clif Droke
www.clifdroke.com
Clif Droke is the editor of the daily Gold & Silver Stock Report. Published daily since 2002, the report provides forecasts and analysis of the leading gold, silver, uranium and energy stocks from a short-term technical standpoint. He is also the author of numerous books, including 'How to Read Chart Patterns for Greater Profits.' For more information visit www.clifdroke.com
Clif Droke Archive |
© 2005-2022 http://www.MarketOracle.co.uk - The Market Oracle is a FREE Daily Financial Markets Analysis & Forecasting online publication.