Economy and PE Ratio Impact on Long-term Stock Market Investment Returns
InvestorEducation / Stock Market Valuations Mar 15, 2008 - 03:59 AM GMTBy: John_Mauldin

- Muddle Through Gets A Boost
- Honey, I Vaporized My Customers
- Consumer Spending is Going, Going...South
- The Boomers Break the Deal
Today we drop back to take a look at the economy and its long term effect on our portfolio returns. I am in Orlando this week, speaking at the Newport Advisor Conference sponsored by the Newport Group. The attendees are primarily investment advisors focused on larger retirement accounts and pensions. This week's letter is the gist of my speech I gave yesterday, as the entire speech would be way too long for a weekly letter. I want to thank the Newport Group for letting me do this, and thanks for the very kind way they have hosted me. Note: this week's letter will print a little longer as there are a lot of graphs. And next week I will address the housing market, as was my intention this week.
The Muddle Through Economy: The Future of the Market and Your Investments
It is increasingly widely agreed that we are now in a recession as I predicted this time last year. The good news is that much of the underlying economy is not in that bad a shape, but it has had two serious body blows administered by the twin collapsing bubbles of the housing market and the credit crisis.
My position is that the recession will be rather long and relatively shallow, and the inevitable recovery will be longer and more drawn out than is typical, resulting in what I call The Muddle Through Economy for a period of several years. I define a Muddle Through Economy as one which grows below normal trend GDP growth of 3% for a period of time, typically in the 2% range.
So, one of the key questions is: "When does the recovery start and how long will it take to get back to 3% GDP?"
I think the answer is that it will not be before the latter half of the year and will take at least two years to get back to trend growth. The reason for such a drawn out recovery is simple. The twin causes (housing and the credit crisis) will take at least two years and possibly longer to normalize, and that process is going to negatively effect several other sectors of the economy.
But then I am an optimist. Duke University released a survey yesterday of Chief Financial Officers of major corporations. This is a gloomy bunch. 54% think we are already in a recession. My friend Duke Professor Campbell Harvey said: "In contrast, 90 percent of the CFOs do not believe the economy will turn the corner in 2008. Indeed, many of them believe it will be late 2009 before a recovery takes hold."
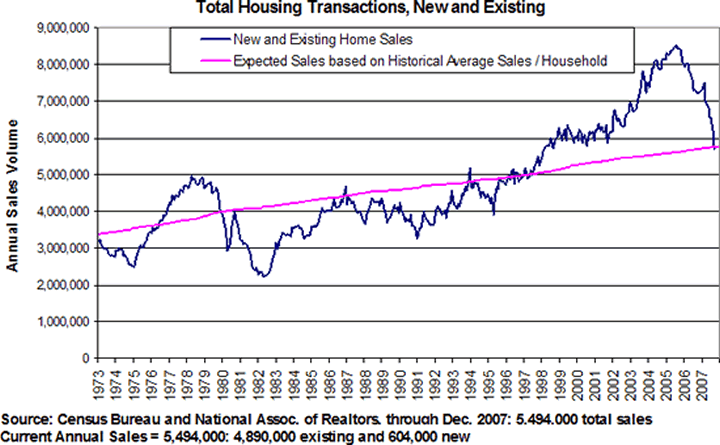
Let's look at a chart courtesy of John Burns Real Estate Consulting. This shows that part of the bubble in housing was in the number of transactions that occurred during the bubble years. In 2005 alone, there were 48% more housing transactions that occurred than should have been expected based on historical average sales per household. In large part this was caused by "investors," many of dubious financial strength, buying homes and condos on readily available credit with no real lending standards and no way to pay the loans if they were not able to sell them at a higher price.
As a result, there are now 3.5 million excess homes that need to be filled by qualified homeowners. Over time, due to growth in the population, the demand will eventually catch up, but that will be a process of several years. Housing prices will have to fall by another 15-20% or so to get to a place where homes become affordable to the marginal buyer. And that assumes rates can stay low.

Annual new and existing home sales are currently running at about 5.5 million. John Burns expect that will fall to about 4 million before we see the bottom of the market. Notice, in the above chart, the drop in sales after the increase in housing sales above the trend projection in the 70's. We have a long way to go to correct the recent bubble, and Burns's research suggests that we will get there sooner rather than later.
But this means that home values will drop another 15% or more. Homeowners are going to see $5-6 trillion in home equity vanish in the next year. Remember that point as we will address it in a minute.
Honey, I Vaporized My Customers
By now, everyone knows that the subprime crisis started with non-existent lending standards which resulted in the large numbers of foreclosures we are seeing today. Those foreclosures will be rising throughout the year. We are not near anything like the top of the rising number of foreclosures. Ben Bernanke said last July that losses from the subprime would be in the $100 billion dollar range. True confession. I think I wrote six months earlier that it would be $200 billion. I point that out to make the point that I am an optimist by nature. The latest "bidding war" number for the amount of total losses is about $500 billion from Goldman Sachs, and a neat $1 trillion from uber-bear Nouriel Roubini.
Add in hundreds of billions from losses which are piling up in other credit markets and you can easily get to $1 trillion in losses which are going to have to be eaten by all sorts of financial institutions, without being all that pessimistic.
Banks are being forced to reduce their loan and margin books in order to get the necessary capital required by regulatory authorities. Plus, credit is now more expensive as risk premiums rise from absurdly low levels in what more than one authority called a "new era of finance." Turns out it was just normal old era greed.
It is not just the mortgage market. It is commercial mortgages, safe municipal bonds, credit card debt, student loans and a host of credit that is under fire and cannot find a buyer at what should be a realistic price.
We should not be surprised at the lack of liquidity in the credit markets. We have essentially vaporized 60% of the buyers of debt in the last six months. The various alphabet of SIVs, CLOs, CDO, ABS, CMBS, and their kin that were the real shadow banking system are either gone or on life support. It took decades to build these structures and it is not realistic to think we can replace them in six months. This is going to take some time.
And time is what the Fed has bought this week by offering to take AAA mortgage paper and swap it for T-bills. They will start with $200 billion on offer. Remember you read it here first that that number will be increased and increased again. From the markets initial euphoric response, you would think the problems have been solved and banks will once again start lending. Sadly, this is probably not true.
This is similar to the action by the bank regulators in 1980, when nearly every major bank had losses that were greater than their capital on Latin American loans which had defaulted. The Fed, with a wink and a nod, allowed the banks to carry these worthless loans on their books at full face value. It took six years before they started to actually write them down. But without that measure, every major bank in the US would have gone bankrupt. And technically, they were for several years. But the Fed action simply bought the banks time to re-liquefy. It was the right thing to do.
This week's action by the Fed is essentially the same thing. It buys time. This 28 day auction will be around for a long time. If the banks had to write down the potential losses on their AAA Fannie Mae paper and other similar assets, it could have brought the banking system to its knees. Eventually, we will get a market clearing price for all this paper, but the key word here is eventually. We are going to see foreclosures and losses for another 18 months. It is going to take a long time to know exactly what the losses will be.
I think the losses on many of the various forms of debt have been marked down way too far by the various derivative markets. (I would hasten to add this does not include the subprime markets, as many of those assets are going to zero.) I doubt the loss in a lot of the debt paper will be nearly as much as the current credit default swaps prices indicate. For instance, some municipal bond debt is priced for 10-15% losses, when losses of less than 0.5% are normal. When there is a buyers strike, prices fall, and sometime to quite low levels. In the fullness of time, the price of these bonds will rise back to "normal" levels. There is a reason Bill Gross is buying municipal bonds by the train car load. Many are simply at the best prices we will see in my lifetime.
But if that debt is now on a bank's capital books, they have to write it down to the latest mark-to-market. The Fed's move simply allows the banks to move what will eventually (or maybe the better word is should eventually) be marked back to reasonable values. It avoids a crisis today.
The next crisis? I read a very chilling piece from Michael Lewitt this morning. He speculates on what if the rumors were true that Bear Stearns is basically bankrupt. Bear is in the too big to fail category. They are at the heart of the chain of Credit Default Swaps which run like fault lines throughout the world's financial system. If Bear were allowed to collapse, it would simply cascade throughout the world so fast it would truly make the current level of the credit crisis seem small potatoes.
So, why can I be so sanguine? Because the regulators (the Fed and the SEC) would step in and whatever large bank was failing would be merged or bought very fast. Liquidity and assets would be provided. The Fed and the rest of the world's central banks get that we are in a crisis. They will do what is necessary. Those of us sitting in the cheap seats in the back of the plane may not like it, as it will look like a bailout of the big guys who caused the problem, but you have to maintain the integrity of the system. A hedge fund here or there can go, but not one of the world's premier banks.
I wrote the above paragraphs on Thursday, and sure enough, the NY Fed and JP Morgan stepped in to bail out Bear. This will not be the only time or bank. The regulators may have been asleep, but the depth of this crisis has awakened them.
But this is a boost for my contention that we will be in a Muddle Through Economy for a long time. This latest Fed actions simply draw out the time over which the market will correct. But that is a good thing, as a too swift, dead drop correction could spawn a very deep recession, destroying vast amounts of capital, which would take much longer to come out of.
Now, let's look at the implications of this crisis on our long term returns and retirement portfolios.
Consumer Spending is Going, Going...South
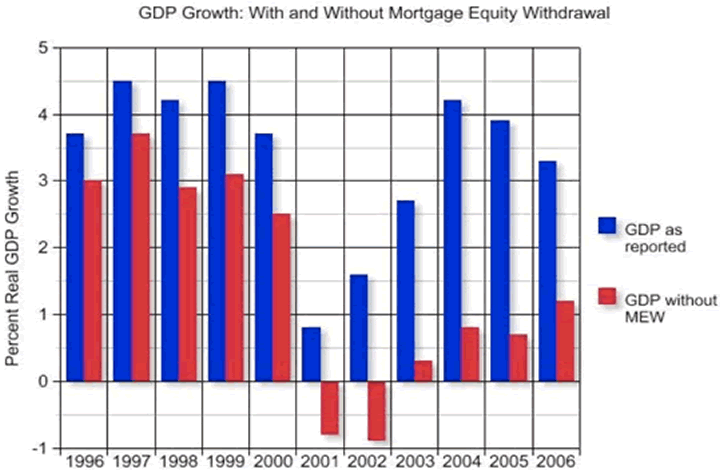
I have used this graph before, but it bears keeping this in mind. Mortgage Equity Withdrawals (MEWs) accounted from 1.5%-3% of overall GDP from 2001 through 2006, as the US consumer used borrowed on the equity in their homes to spend.

And it's not just MEWs weighing on the consumer. Higher energy costs are just as effective as a tax in lowering consumer spending. If oil stays where it is today, gasoline will be $4 a gallon this summer. Unemployment is slowly rising, which of course is not good for consumer spending. Inflation is hurting, especially in light of the very low growth in real consumer income. Combine that with less availability of cheap and easy borrowing and the consumer is clearly going to have to re-trench.
So, what does that mean? Two things. I think it will mean lower corporate profits for a variety of US corporations, and as we will see, in a normal recessionary pattern pull the stock market lower. And that is going to lead to less than expected long term returns on retirement portfolios, which will have its own consequences.
Let's review some basics. I made the contention in Bull's Eye Investing that we should look at bull and bear market cycles in terms of valuations rather than price. Stock markets go from high valuations to low valuations and back to high valuations over very long term cycles, averaging around 17 years. That would mean we are roughly halfway through this secular bear market which began in 2000. I also pointed out a few weeks ago that the bottom in terms of price in the last secular bear market (1966-1982) was made in 1974, but it was 8 years later than the bottom in valuations as expressed by Price to Earnings Ratio was reached. These periods of low valuation are the springboard for the next bull market rise, so there is a bull market coming. We just have to be patient.
It is entirely possible that we see the bottom of the market in terms of price this year as the market falls due to the pressures of the recession we are in, yet valuations continue to fall even as prices rise. In fact, that is typical of the secular bear cycles. This happens as earnings rise faster than stock prices.
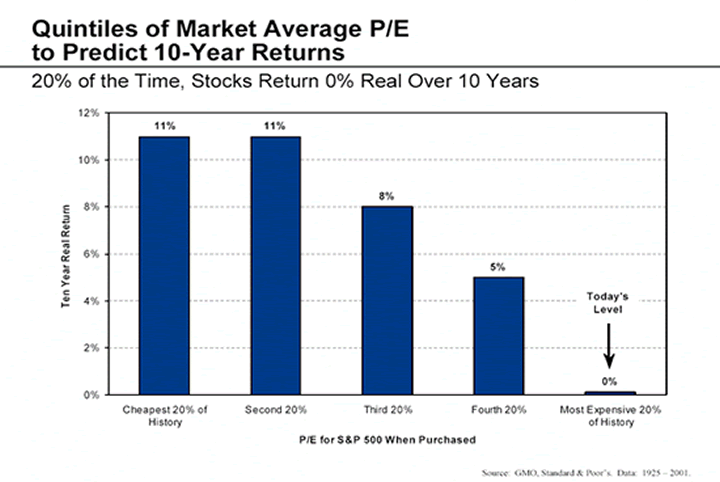
And why is that important? Because the returns on your stock portfolio are closely and highly correlated with the P/E ratios at the time of your investments. Besides the following chart, you can go to www.2000wave.com and look at the stock market charts on the right side to see what kind of returns you would have had over any given period during the last 100 years. Notice on those charts that if you start with high P/E ratios, your returns could be negative for 20 years! Not quite the 10% compounding that many planners promise.

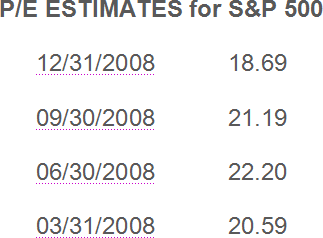
So, where are today's P/E ratios? Let's go to the data provided by Standard and Poor's for the S&P 500. In January of 2007, S&P estimated that earnings for 2007 would be $89. Earnings for 2007 were actually $71.56, down about 20%. Last year about this time S&P estimated that earnings for 2008 would be $92. Today they estimate 71.20 for 2008. Lately every time new estimates come out they are down. But that is typical in a recession. Analysts are generally behind the curve.
But as the table below shows, we are now at P/E ratios that are back up over 20, and going to 22 by the middle of the summer. That would suggest that total returns are going to be under pressure for the next few years at a minimum and maybe for a decade. That does not bode well for retirees who are expecting the stock market to compound at 8-10% annually in order for them to be able to retire in the style to which the want to be accustomed. Real (inflation adjusted) returns of between 0 and 4% are more likely based on historical returns from today's valuations.

The Boomers Break the Deal
I have good news and bad news. First, the good news. Basically, my generation – the Baby Boomers- is going to break the deal my Dad's generation made with my kids. They agreed to die on time. The Boomer Generation and subsequent generations are going to live longer –potentially much longer - than the current actuarial tables suggest because of major breakthroughs in medicine and health care. It is quite conceivable that we will see another average ten years of average life for the Baby Boomer Generation. I personally fully intend to enjoy those years.
But the bad news is that many have not saved enough for an extended life span, let alone 30 years of retirement. My friend Ed Easterling at Crestmont Research did some very interesting analysis a few months ago. You have saved and invested, and now you want to retire. You decide to take out 5% of your total portfolio to live each year and increase the amount for inflation, so that you can maintain your lifestyle (a number which a surprising number of investment advisors would say is ok). Let's say you are an aggressive older couple and decide to stay in the stock market because that is where you are told that you can get the best returns over time. And you know that at least one of you have the probability of living 30 years. On average you are going to get 7-8% or more on your stock portfolio, right?
Ed calculates what you would get for 78 different 30-year periods since 1900. Let's say you start with a million dollars. On average, this has been a good bet. You could maintain your lifestyle and end up with $3.6 million. You've been pretty conservative, right?
Wrong. Because the returns you get over the next 30 years are highly dependent on the P/E ratios at the beginning of those 30 years. Let's break up those 30-year periods into four quartiles of beginning valuation. If you start in a period when P/E ratios are in the highest quartile, you find that over 50% of the time you end up penniless, on average within 22 years. Here's that data from Ed:

As we saw above, valuations are well into that top 25% quartile. Notice that even when starting with the lowest-quartile valuations that 5% of the time you ran out of money within 23 years. Want to take a lifestyle bet that you have a 1 in 20 chance of losing? It will not be fun to have to go to work as a Wal-Mart greeter at 80.
Of course, there are other implications. A generation living longer means that the seemingly pessimistic forecasts of doom and gloom for Social Security and Medicare are not pessimistic enough. Defined benefit pension plans will be in real trouble at the end of the next decade.
So, what should you do? In secular bear cycles like we are in now, you should look for absolute return style investments, like income portfolios, hedge funds and other alternative style investments, be more nimble in your stock picking rather than using index funds and expect overall lower returns. We need to be patient and wait for the lower valuations which have always eventually made themselves evident.
Mexico, London, and Switzerland
The Newport Group brought in Chris Gardner to speak after me. It was one of the most inspirational stories I have ever heard. Chris was the man who wrote the Pursuit of Happyness which was the basis for the movie of the same name with Will Smith playing the role of Chris. As he related his life, it was even tougher than the movie. It makes me realize how important being a father is, and how much we owe to our parents who stayed with us, and how incredibly important it I to be there for our kids. Get the book and see the movie, and if you ever get a chance to her him speak, do so.
I get more than a few letters from readers who think my Muddle Through Scenario is a little too optimistic. If you want to read the bearish case, you can sign up for my friend Bill Bonner's the Daily Reckoning. It is a free service and very well written. Bill and his associates are from the Austrian economic camp, and go through a lot of data in an entertaining manner. You can subscribe for free at: http://www.dailyreckoning.com /Sub/MWAVEsignup.html
As noted above, I am in Orlando and getting ready to go to the Arnold Palmer Invitational Golf tournament in a few minutes. The speech went well, and now it is R&R time. It looks like I will be going to Playa del Carmen in Mexico (south of Cancun) in a few weeks over a weekend to speak to a group of NFL football players. Now that should be interesting. Then I will be in London for two days April 15-16 and then on to Switzerland for the rest of the week. Drop me a note if you want to meet.
Lunch and golf are calling, so I am going to his the send button early. Have a great week, and remember to have some fun on the way as we Muddle Through.
Your life is getting better every week analyst,
By John Mauldin
John Mauldin, Best-Selling author and recognized financial expert, is also editor of the free Thoughts From the Frontline that goes to over 1 million readers each week. For more information on John or his FREE weekly economic letter go to: http://www.frontlinethoughts.com/learnmore
To subscribe to John Mauldin's E-Letter please click here:http://www.frontlinethoughts.com/subscribe.asp
Copyright 2008 John Mauldin. All Rights Reserved
John Mauldin is president of Millennium Wave Advisors, LLC, a registered investment advisor. All material presented herein is believed to be reliable but we cannot attest to its accuracy. Investment recommendations may change and readers are urged to check with their investment counselors before making any investment decisions. Opinions expressed in these reports may change without prior notice. John Mauldin and/or the staff at Millennium Wave Advisors, LLC may or may not have investments in any funds cited above. Mauldin can be reached at 800-829-7273.
Disclaimer PAST RESULTS ARE NOT INDICATIVE OF FUTURE RESULTS. THERE IS RISK OF LOSS AS WELL AS THE OPPORTUNITY FOR GAIN WHEN INVESTING IN MANAGED FUNDS. WHEN CONSIDERING ALTERNATIVE INVESTMENTS, INCLUDING HEDGE FUNDS, YOU SHOULD CONSIDER VARIOUS RISKS INCLUDING THE FACT THAT SOME PRODUCTS: OFTEN ENGAGE IN LEVERAGING AND OTHER SPECULATIVE INVESTMENT PRACTICES THAT MAY INCREASE THE RISK OF INVESTMENT LOSS, CAN BE ILLIQUID, ARE NOT REQUIRED TO PROVIDE PERIODIC PRICING OR VALUATION INFORMATION TO INVESTORS, MAY INVOLVE COMPLEX TAX STRUCTURES AND DELAYS IN DISTRIBUTING IMPORTANT TAX INFORMATION, ARE NOT SUBJECT TO THE SAME REGULATORY REQUIREMENTS AS MUTUAL FUNDS, OFTEN CHARGE HIGH FEES, AND IN MANY CASES THE UNDERLYING INVESTMENTS ARE NOT TRANSPARENT AND ARE KNOWN ONLY TO THE INVESTMENT MANAGER.
John Mauldin Archive |
© 2005-2022 http://www.MarketOracle.co.uk - The Market Oracle is a FREE Daily Financial Markets Analysis & Forecasting online publication.


