


Silver Price and COT Data
Commodities / Gold and Silver 2013 Apr 25, 2013 - 04:42 PM GMTBy: DeviantInvestor

 The Commitment of Traders data is published every Friday. It lists the reportable positions of the commercial and non-commercial traders for silver contracts on the COMEX.
STOP! Yes, I know
•The data is manipulated. The same people who brought us LIBOR, flash crashes, high frequency trading, and the most recent gold and silver crash are the people who report the data.
•Experienced traders like Jim Sinclair understand the inner workings of this data far better than I, and it is my impression that he is skeptical of the value of the COT data.
•The data is subject to revision, errors, and occasional changes in definitions.
•Not everyone in the world is honest in their reporting (really?), and the regulation and enforcement might be a bit lax (really?).
But, given the above, let’s look at the data and USE WHAT WE HAVE.
•First: Take the non-commercial category and net the longs and shorts. Call this the non-commercial net longs.
•Second: Take the commercial category and net the longs and shorts (longs minus shorts – may be negative). Call this the commercial net longs.
•Third: Subtract the commercial net longs from the non-commercial net longs. This provides a rough estimate of the difference in commitment to silver between those two broad groups of traders on the COMEX. So what? Is it valuable? Does it tell us anything useful about probable future price changes?
Examine the graph. The COT non-commercial net longs less the commercial net longs (in the legend as “net long”) are shown in red. Pay attention to the red circles where the “net long” drops below 50,000.
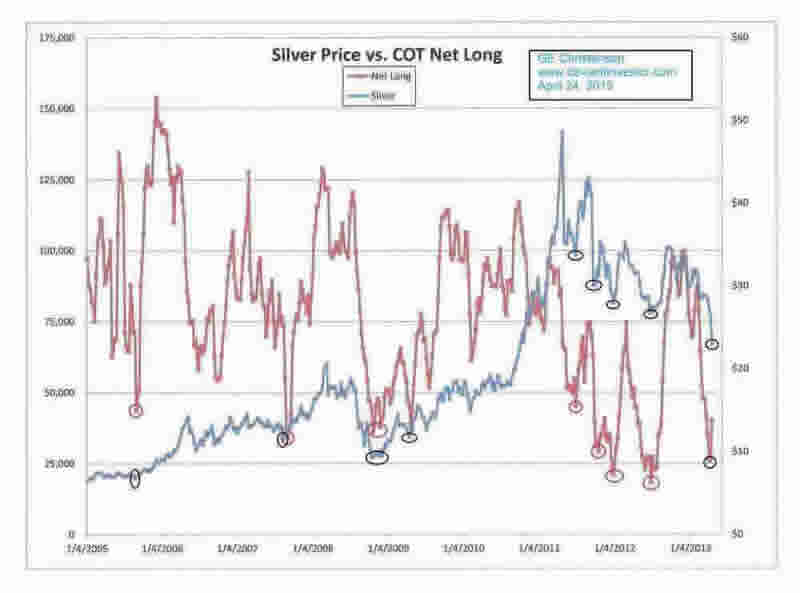
The price of silver (in dollars) since 2005 is shown. Note the black circles that roughly correspond to the red circles. Each red circle (low in “net long”) was a buying opportunity, and silver subsequently rose in price. Some were excellent long-term opportunities, such as September 2005, August 2007, October 2008, and April 2009. Others, such as July 2011, October 2011, December 2011, and June 2012, were good but short-lived buying opportunities.
Conclusions
In spite of the supposed manipulation and distortion in the data, it does have some value indicating future price direction.
The data is better at picking price bottoms than tops. Do NOT trade using this data alone. NOW looks like a price bottom.
The data will probably NOT tell you if the current “bottom” is one in a series of lower lows in a bear market or if it is a multi-year bottom and the beginning of a new bull market.
My Opinion
This current bottom is more like the bottom in 2008 after that 55% washout than any other bottom in the past three decades. I expect that now is a significant bottom, and we will see substantially higher prices over the next several months and several years. Unfortunately, I also expected the same after the June 2012 bottom. So, we’ll wait and see… In the meantime, go back and review the fundamental case for silver and gold.
Read: Why Buy Silver? and Why Buy Gold?
GE Christenson
aka Deviant Investor
If you would like to be updated on new blog posts, please subscribe to my RSS Feed or e-mail
© 2013 Copyright Deviant Investor - All Rights Reserved Disclaimer: The above is a matter of opinion provided for general information purposes only and is not intended as investment advice. Information and analysis above are derived from sources and utilising methods believed to be reliable, but we cannot accept responsibility for any losses you may incur as a result of this analysis. Individuals should consult with their personal financial advisors.
© 2005-2022 http://www.MarketOracle.co.uk - The Market Oracle is a FREE Daily Financial Markets Analysis & Forecasting online publication.