


U.S. Economic Recovery Explained in One Simple Chart
Economics / Economic Recovery Apr 25, 2013 - 01:53 PM GMTBy: Money_Morning

 Ben Gersten writes: If you thought Americans were better off financially than a few years ago, the following chart shows that's not the case for most of us.
Instead, it looks like an economic recovery for the rich.
According to a new Pew Research Center study, the wealthiest 7% of Americans saw their net worth increase 28.2% from 2009-2011, while the net worth of the other 93% declined 4.3%.
During that span, the average net worth of the 8 million households in the richest 7% rose to about $3.2 million from about $2.5 million while the average net worth of the 111 million households in the bottom 93% fell to $133,817 from $139,896, the study said.
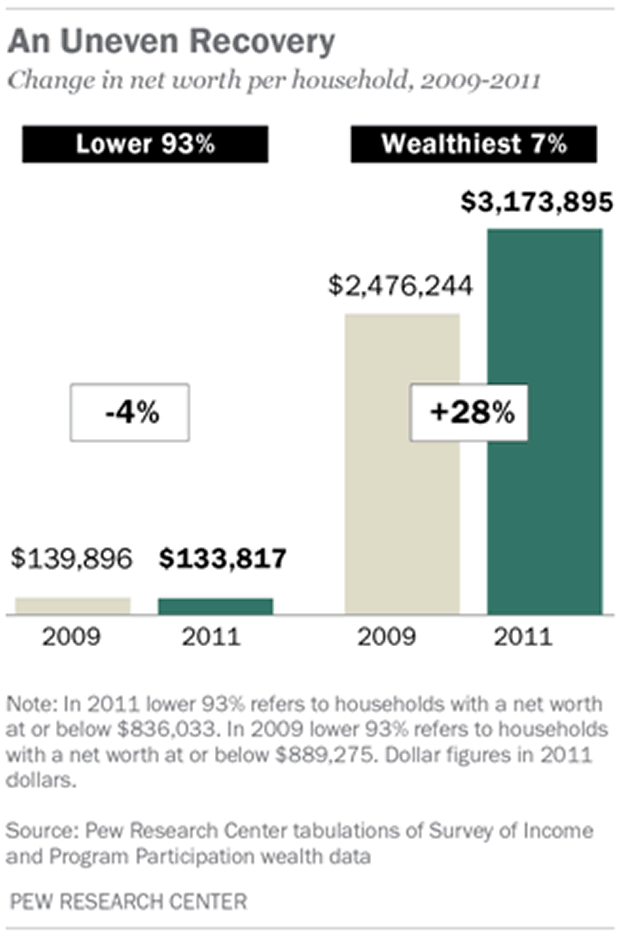
That means the average net worth of the wealthiest 7% of American households in 2011 was 24 times greater than the average wealth of the other 93%, up from roughly 18 times greater in 2009.
"The income recovery thus far for a wide swath of U.S households has not existed," Richard Fry, senior research associate at the Pew Research Center, told the Huffington Post. "One of the reasons is because most Americans households own a home [and] very few own stocks."
Indeed, among households with net worth of $500,000 or more, 65% of their wealth comes from financial holdings such as stocks, bonds and 401(k) accounts, while only 17% comes from their homes.
By contrast, for households with net worth under $500,000, just 33% of their wealth comes from financial assets and 50% from their homes.
Bottom Line: If you're not already invested, you need to be in the market and in it for the long run.
Source :http://moneymorning.com/2013/04/24/this-chart-shows-the-economic-recovery-is-mainly-for-the-rich/
Money Morning/The Money Map Report
©2013 Monument Street Publishing. All Rights Reserved. Protected by copyright laws of the United States and international treaties. Any reproduction, copying, or redistribution (electronic or otherwise, including on the world wide web), of content from this website, in whole or in part, is strictly prohibited without the express written permission of Monument Street Publishing. 105 West Monument Street, Baltimore MD 21201, Email: customerservice@moneymorning.com
Disclaimer: Nothing published by Money Morning should be considered personalized investment advice. Although our employees may answer your general customer service questions, they are not licensed under securities laws to address your particular investment situation. No communication by our employees to you should be deemed as personalized investent advice. We expressly forbid our writers from having a financial interest in any security recommended to our readers. All of our employees and agents must wait 24 hours after on-line publication, or after the mailing of printed-only publication prior to following an initial recommendation. Any investments recommended by Money Morning should be made only after consulting with your investment advisor and only after reviewing the prospectus or financial statements of the company.
Money Morning Archive |
© 2005-2022 http://www.MarketOracle.co.uk - The Market Oracle is a FREE Daily Financial Markets Analysis & Forecasting online publication.