


Central Bankers Are Golden Toast On A Silver Spoon
Commodities / Gold and Silver 2013 Apr 20, 2013 - 10:32 PM GMTBy: Michael_Noonan

 Memo To Central Bankers:
How dumb can you be? What better way to expose your naked short backside than to trash a market with known world-wide demand? So arrogant, so parochial. The world thanks you. The bullion dealers than you. The gold/silver buyers thank you.
When there is more and more smoke about the possibility of the bullion cupboards being bare, the fiat-makers are doing the same thing to paper gold and silver as they have done to currencies: destroying them.
Those few banks responsible for the naked shorting in both gold and silver do not have to post any margin, nor do they have the underlying physical were they required to make delivery. In essence, they are doing what bankers only know how to do: create fiat paper gold and silver that exists only in the minds of the mis-guided believers.
People who are following the "yellow brick road" are discovering that the "Wizard behind the curtain" is a collective of the three main characters: no brain, no heart, a total coward, and most importantly, no true power! Central bankers are a bunch of munchkins.
We have frequently stated that those with power will not give it up without a fight, and that they will stop at nothing to retain it. You are witnessing an example of the extremes to which the fiat-issuers will go. We have also frequently warned that when it comes to markets, Anything Can Happen! You have an example of both, from last week.
We know from direct experience that the available supply for physical gold and silver is becoming more problematic, and the premiums have exploded. Almost all dealers have no supply to meet the real demand for one ounce gold and silver coins. They stopped selling them, and availability for 10 oz and higher bars has been delayed for weeks. For this, too, we have been sounding the alarm.
Price is not the ultimate issue, at this stage. Owning and having possession of the physical is what matters. Silver may be at $23, and gold at $1,400, but try buying them at those prices! Get what you can, whatever the price.
In a Commentary from a few weeks ago, [Comex Prices Manipulated? Still "Accurate." http://bit.ly/YYX5HV, if you missed it, and it also captures the essence of why the physical market is so much more important than the paper one, relative to what just occurred, last week], the point was that the charts which reflect New York and London exchange traded paper is precisely what the central banking cartel wants everyone to "see" and "believe." Their attempt to have "paper cover rock" scam is tearing apart.
These charts have lost relevancy because they do not reflect the actual demand for the underlying physical metals, but they do show some interesting points. The spike lower for April, not yet over, shows what central bankers want you see and "fear," but what the chart does not show is that behind that "curtain," demand for the physical has spiked even more to the upside!
Instead of driving people away from gold and silver by artificially suppressing the now fiat paper market, the true picture is in the physical market, and around the world, investors are flocking to dealers to buy record amounts of gold and silver. Reports from China, Singapore, Hong Kong, India, Australia indicate long lines of more than willing buyers to "get while the getting has gotten better!" Now, it takes less of the trash fiat to buy more of something with real intrinsic value. Unfortunately, most Americans are missing the boat, but those who do know are also experiencing delays, unavailability, and sharply higher premiums.
Larger Image
We often state that exceptionally high volumes are an indication of a transfer of risk from weak hands into stronger hands. Irony of ironies, the central bankers are now the weak hands, and their efforts to suppress PMs has merely fed the voracious appetite existing for direct ownership of the physical, the undeniably stronger hands.
Central bankers are committing financial suicide and bringing about consequences that are directly opposite from what they intended. What should remain uppermost in the minds of the buyers/holders of the physical PMs, [Cheers to you all!], is the time factor. It is unlikely either market will turn around any time soon.
The assault is not over. Wide range bars, and especially those with exceptionally high volumes, also tend to lead to trading ranges in the following weeks or months. It takes time to digest and absorb the risk transfer.
From wherever the ultimate low of the current down swing will be, price will trade in that range, as shown below using last week's low as an example. Patience will now be required. Those who have, and those still acquiring physical gold and silver can relax and let the natural order of supply and demand restore itself from its present distortion, however long it may take.
Can silver still go lower? Yes, it can. Will it? Momentum is to the downside, at present. No one knows that answer, just as no one expected what just happened in the manner in which it did. We drew a potential support line but have no responsible answer as to where this swing low will end.
As explained in the daily gold chart, you can expect a protracted TR to follow for some time into the near future. It is worth noting that when "surprises" hit the market, they tend to do so in the direction of the existing trend.
The trend for futures is down. The trend for demand of the physical is telling a different story. While we often say, "Charts do not lie," sometimes the truth is hidden. There are exceptions to everything. History is on the side of gold over fiat. If you want to know the future, look to the past.
We conclude with some interesting charts from a Chris Martenson article, This Gold Slam Is A Massive Wealth Transfer From Our Pockets To The Banks." For those who hold/own physical gold and silver, we say there was no such wealth transfer. Most reports say that demand for the physical increased sharply. Paper holders got hurt, but there have been so many warnings not to hold any form of paper that people make choices, and choices come with consequences.
The point of his charts is to see what so many have been saying about market manipulation. It is alive and well.
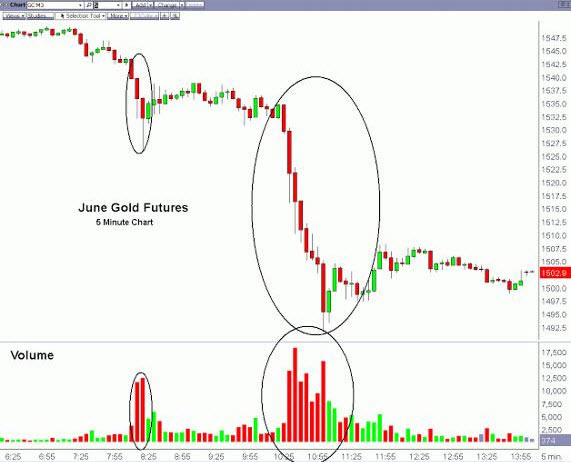
The areas circled represent the largest 'dumps' of paper gold contracts that I have ever seen. To reiterate Ross's comments, there is no possible way to explain those except as a concerted effort to drive down the price.
To put this in context, if instead of gold this were corn we were talking about, 128,000,000 tonnes of corn would have been sold during a similar 3 hour window, as that amount represents 15% of the world's yearly harvest. And what would have happened to the price? It would have been driven sharply lower, of course. That's the point, such dumping is designed to accomplish lower prices, period, and that's the very definition of market manipulation.
For a closer-up look at this process, let's turn to Sunday night and with a resolution of about 1 second (the chart above is with 5 minute 'windows' or candles as they are called). Here I want you to see that whomever is trading in the thin overnight market and is responsible for setting the prices is not humans. Humans trade small numbers of contracts and in consistently random amounts.
Here's an example:
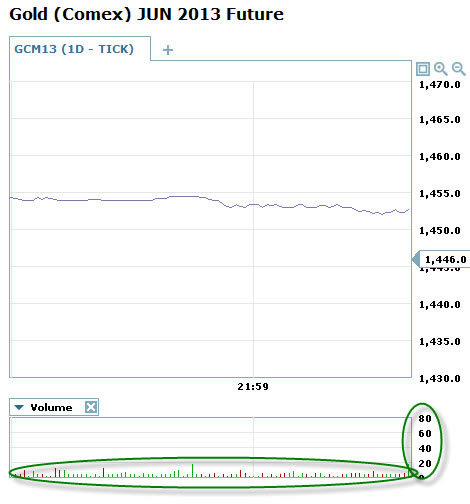
Note that the contracts number in the single digits to tens, are randomly distributed, and that the scale on the right tops out at 80, although no single second of trades breaks 20.
Now here are a few patterns that routinely erupted throughout the drops during Sunday night (yes, I was up very late watching it all):
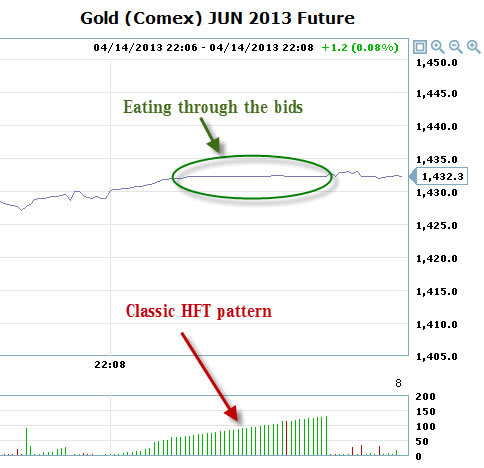
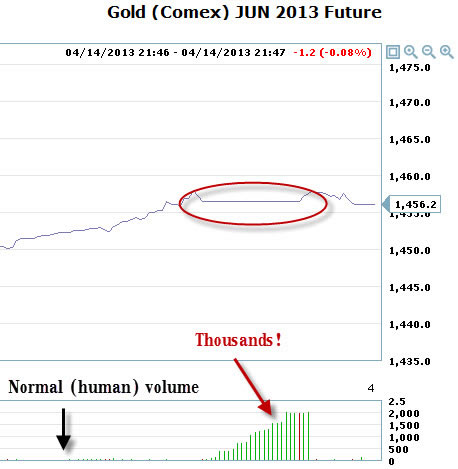
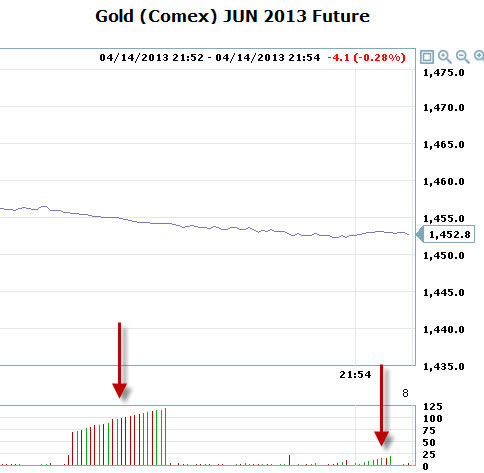
These are just a few of the dozens of examples I captured over a single hour of trading before I lost interest in capturing any more.
By Michael Noonan
Michael Noonan, mn@edgetraderplus.com, is a Chicago-based trader with over 30 years in the business. His sole approach to analysis is derived from developing market pattern behavior, found in the form of Price, Volume, and Time, and it is generated from the best source possible, the market itself.
© 2013 Copyright Michael Noonan - All Rights Reserved Disclaimer: The above is a matter of opinion provided for general information purposes only and is not intended as investment advice. Information and analysis above are derived from sources and utilising methods believed to be reliable, but we cannot accept responsibility for any losses you may incur as a result of this analysis. Individuals should consult with their personal financial advisors.
Michael Noonan Archive |
© 2005-2022 http://www.MarketOracle.co.uk - The Market Oracle is a FREE Daily Financial Markets Analysis & Forecasting online publication.