


Silver Statistical Correlations
Commodities / Gold and Silver 2013 Apr 01, 2013 - 06:35 PM GMTBy: DeviantInvestor

 Begin the analysis in 1971 when Nixon dropped the link between the dollar and gold. A pack of Marlboros cost (depending on local taxes) about $0.39. We paid about $0.36 for a gallon of gasoline. The DOW Index was about 850. Silver was priced at about $1.39.
Times have changed! Read Part 1 of Silver - Keep It Simple!
Today we have more currency in circulation, far more debt, and much higher prices - what does it mean?
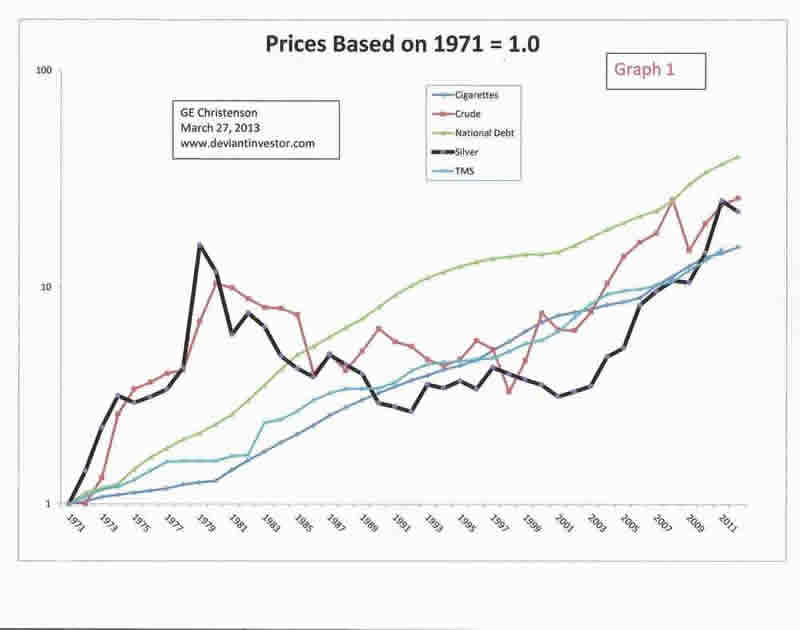
Examine Graph 1. The prices for retail cigarettes, crude oil, national debt, silver, and the true money supply (TMS) (see notes at end) are shown on a log scale graph with all prices normalized to start at 1.0 in 1971.
-
National debt (green line) has increased rapidly since 1971 and even more rapidly, on average, than the other items. (National debt has increased over 12% per year for the last five years.)
-
Silver (black line) and crude oil (red line) prices have been erratic with peaks in the early 1980s, troughs in the late 1990s, and substantial rises since 2001.
-
Cigarettes and TMS have increased steadily since 1971.
-
TMS (also M2, M3, etc.), debt, and most commodity prices have increased exponentially since 1971. Because the dollar was not backed by gold, dollar creation, total debt, and prices increased rapidly.
-
Not shown are some prices that increased more rapidly (medical costs and college tuition) and some that increased more slowly (postage and bread).
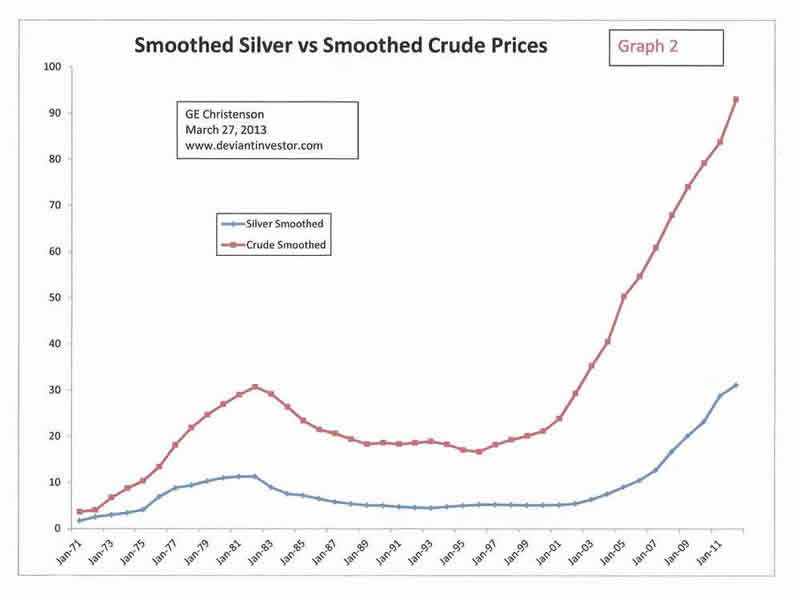
Graph 2 shows annual silver and crude prices smoothed with a centered five period moving average. This removes much of the "noise" in the price data and shows longer term trends better. Note that the price of silver actually reached about $50 per ounce in early 1980, but the average daily price in 1980 was only $16.39; the smoothed daily average was about $11.
Statistical Correlations
-
Silver prices in dollars (annual average of daily price) correlated with crude prices in dollars (annual average of daily price) at 0.83 - a good correlation. Both are commodities, both are affected by politics, and both are sensitive to money supply, actual inflation, and inflationary expectations.
-
TMS correlated with national debt at 0.99 - a tight correlation. When budget deficits increase the national debt, the money supply expands accordingly.
-
Silver prices (annual average shown) correlated with national debt at 0.67 and with TMS at 0.58. The smoothed silver price correlation to national debt was 0.76 over 40 years and much higher over the past 13 years.
-
Silver prices (smoothed) correlated with crude prices (smoothed) at 0.93 - an excellent correlation.
So What?
-
National debt correlates tightly with TMS. Smoothed silver prices correlate well with both national debt and TMS. We may be apprehensive about future silver prices, but we can be 99.99% certain about the inevitable increase in national debt. Based on the 40 year correlation between silver and national debt, silver prices will continue to rise.
-
Both crude oil and silver are commodities that experience large price volatility. On average, they go up and down together; and, over a 40 year history, their prices have clearly moved substantially higher. I see many reasons to expect both to move higher in the long term.
-
Crude oil is the most important commodity in the world. Its per capita use, on average, is rising and the world's population is increasing, so demand will remain strong, unless the world suffers a massive financial and economic collapse. Further, the easily available oil has been taken so there is little chance that inexpensive supply will increase. More demand coupled with flat or declining supply requires higher future prices. Higher crude oil prices strongly suggest higher silver prices.
-
Central banks are "printing money" in their desperate attempt to fight deflation, levitate asset prices, bailout banks and countries, and encourage inflation. This guarantees further increases in national debt and TMS and price increases for most commodities including crude oil, cigarettes, and silver.
Price of Silver as a Projection Based on Other Variables
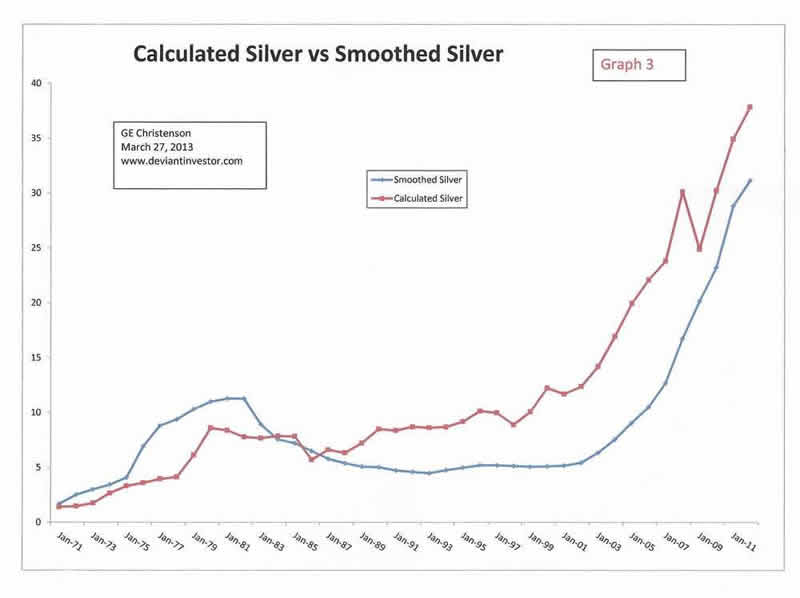
We can construct a calculated price for silver based on three variables - national debt, TMS, and the price of crude oil. Examine Graph 3 of smoothed silver prices and the calculated price of silver based on those three variables. Note that the correlation is 0.86 - quite good. The silver price has both a monetary component (national debt and TMS) and a commodity component (crude oil). Together they produce a simple but effective projection for the smoothed average price of silver over the past 42 years.
For the Future
Assume national debt increases 12% per year for the next five years like it has for the past five years. Assume TMS and crude continue their past five year growth rates (11% and 8%). The estimated price for the smoothed average price of silver is about $55 in 2016. The peak price on a spike higher could easily be triple the smoothed price. Look for $100 silver in 2015 - 2017 unless a deflationary collapse occurs - to the detriment of everyone including banks, politicians, and national governments.
Conclusion
Debt, money supply, and the prices for most commodities have exponentially increased over the past 42 years. Prices for crude oil and silver have substantially increased but inconsistently. I can be certain of death and taxes, and I feel confident that the national debt and prices for crude oil, cigarettes, silver, and most other consumer items will drastically increase in the next few years - under circumstances similar to the past 40 years. A hyperinflationary increase is also possible, in which case, all commodity prices will be unbelievably higher. Assuming no deflationary collapse, expect $100 silver relatively soon - perhaps in 2016. Read Past & Future Speculative Bubbles - What They Indicate for Gold and Silver!
Notes on the Data
-
Cigarette data found at the Center for Disease Control. The 1971 average retail price for a pack of cigarettes, including various taxes, was quoted at $0.39. (I remember paying $0.25 for a pack of Marlboros in the late 1960s.)
-
Crude oil data found at InflationData.com. The 1971 price for a barrel of crude was $3.60.
-
Silver data was found at Kitco. They list the average of approximately 260 daily prices in each year. I used this annual average. Note that the spike high price in 1980 exceeded $50, but the annual average price was only $16.39.
-
National debt data found at TreasuryDirect.
-
True money supply (TMS) data was found at Ludwig von Mises Institute.
-
Gasoline prices from U.S. Department of Energy. The average retail price for gasoline in 1971 was $0.36.
GE Christenson
aka Deviant Investor
If you would like to be updated on new blog posts, please subscribe to my RSS Feed or e-mail
© 2013 Copyright Deviant Investor - All Rights Reserved Disclaimer: The above is a matter of opinion provided for general information purposes only and is not intended as investment advice. Information and analysis above are derived from sources and utilising methods believed to be reliable, but we cannot accept responsibility for any losses you may incur as a result of this analysis. Individuals should consult with their personal financial advisors.
© 2005-2022 http://www.MarketOracle.co.uk - The Market Oracle is a FREE Daily Financial Markets Analysis & Forecasting online publication.