


Solar Cycle Warnings
Politics / Environmental Issues Apr 01, 2013 - 01:31 PM GMTBy: Andrew_McKillop

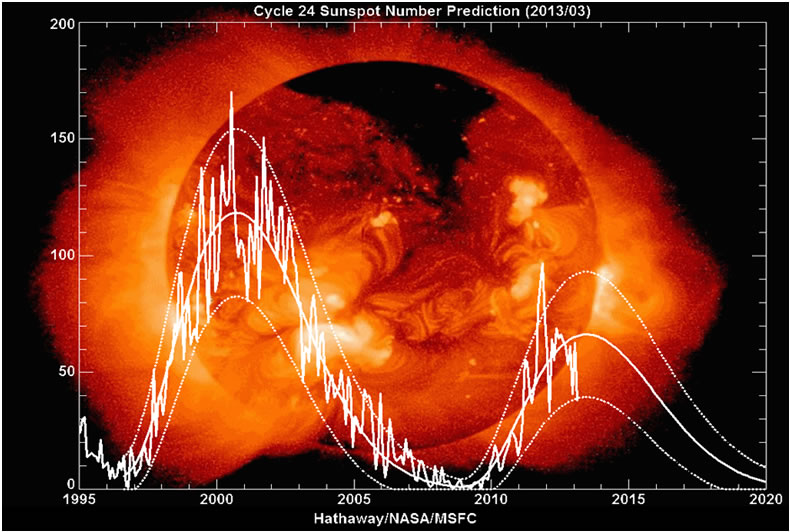
 RECORD LOW SUNSPOT NUMBERS
For reasons including "pure politically correct", NASA has fought a losing battle - against reality - on the subject of Global Warming, which it feels obliged to believe in as a "scientifically correct" theory. Linked to this, quite directly, NASA has also battled against reality on the subject of sunspot frequency, size, location on the Sun's surface and other variables linked to sunspot cycles in this present Cycle 24 of approximately 11-year-long cycles. These have been accurately recorded since Cycle 1 set by convention between astronomers as starting in Feb 1755.
NASA wanted to believe Cycle 24 would be about the same, perhaps bigger in sunspot numbers and intensity, than Cycle 23. This has not happened. Cycle 24 started weak and got much weaker: February 1906 and Fenruary 2013 had one thing in common, they both had extreme low numbers of observable sunspots on "our" local Star. Year 1906 was the year the San Francisco earthquake hit. Other notable events for 1906 included Finland allowing women to vote - the first European country to do it!
Checking the key factor of Average daily sunspot area observable from Earth, as a percentage of the Sun's visible hemisphere for the period from 1875 to the start of 2013, the second diagram in this data set also from NASA http://solarscience.msfc.nasa.gov/images/bfly.gif proves what is happening since at latest Cycle 21 in the 1980s.
Sunsport numbers are declining in number, size and intensity, bringing us back to trends that dominated in Cycles 12 - 16 through 1880 - 1930. Due to the exceptional weak numbers of observable sunspots at present - despite the fact we are near, or already should be at the peak of Cycle 24 which started in 2008 or 2009 - the best or most likely fit with sunspots in that recent historical 50-year period will be Cycle 14. The length of the sunspot cycle, in years, is also a key deciding factor. If the present cycle is short, we are already past its peak, which as already noted is of exceptionally low intensity.
SUNSPOT CYCLES AND ECONOMIC CYCLES
Hardly known as a "great mathematical economist", the US economist Irvin Fisher described the book by British scientist and inventor W. S. Jevons titled The Theory of Political Economy (1871) as "the beginning of the mathematical method in economics". Jevons is often credited as inventor of the Economic Cycle. Apart from his concern about coal resource depletion and its possible impacts on the economy (described in his book 'The Coal Question' 1865), which could be called the first modern "depletionist" theory, his last works and studies before his death concerned his speculation on the connection between economic and commercial crises, and sunspots. At the time of his death he was preparing a major treatise on economics including long-run data tables on the relation of approximately 11-year sunspot cycles, and recurring economic crises - which he thought were linked.
One simple mechanism he suggested was that during the low phases of sunspot cycles, or during very weak sunspot cycles, winters are colder and dryer, and summers are shorter than in the reverse case. This affects agricultural output. Reduced food supplies causes higher food prices, reducing disposable "discretionary" or non-food revenues. When these decline, the economy can tilt into recession. Jevons is also known for his "Energy conservation paradox": When energy saving becomes intense, for any reason including government policy, energy prices will tend to drop, encouraging increased energy consumption but this time after "the low hanging fruit" of easy savings have been utilised.
While modern astronomers, astrophysicists, cosmological physicists and other professionals interested in sunspot cycles have by convention, since 1981, set Cycle 1 of reasonably or very well observed and analyzed sunspots to the year 1755, and have highly detailed series of observations enabling them to state that cycles can run for less than 10 years to more than 14 years, in exceptional cycles, the most recent near-total absence of sunspots dates to the Maunder Minimum of about 1655-1725. Even Cycle 1 starting in 1755 was in "convalescent mode". The Maunder Minimum was responsible for at least 70 years of abnormally cold weather in the Northern hemisphere, and was sandwiched within the very well known (and controversial) cool period known as the Little Ice Age, which lasted from about 1500 to 1800 in the Northern hemisphere. Why it is controversial is because "Global Warmers" have to explain why the Little Ice Age was preceded by a warm phase, and why global temperatures can fall as rapidly as they did, then stayed low, during the Maunder Minimum. No "anthropogenic CO2" was involved.
Two very weak sunspot cycles however took place in the early 19th century. More important this period (called the Dalton Minimum), like the Maunder Minimum but much better documented, was also associated with abnormally intense tectonic and seismic activity - volcanoes, earthquakes and tsunami. The year 1816 had extreme low numbers of sunspots (similar to 2013 !) but climatologists concur that what most shaped 1816's extreme cold phenomena, including intense snow storms, in April, in the US and Europe, was the catastrophic earthquake and volcanic even at Tambora on the island of Sumbawa, Indonesia, in 1815. The ash clouds and sulfur aerosols emitted high into the atmosphere by this volcano were global wide, chilling the climate of the Northern hemisphere for months by blocking sunlight with gases and particles, a phenomenon sometimes called "nuclear winter".
Linking to the Maunder Minimum by the year of its outbreak, near the end of this exceptional 70-year low in sunspot cycles, global earthquake activity included the January 1700 Cascadia quake. This was the single largest-ever known earthquake to hit North America in modern times. It was of about 9 to 9.2 intensity, and ran from a western US focus, affecting a region from Vancouver Island in British Columbia to northern California, with an average slip of 20 metres along an approximately 1 000 kilometer track. This megathrust also caused a tsunami which hit Japan. It would be hard to put a number to the economic damage likely from a similar disaster event, today.
THE 1906 QUAKE
During the heavily documented low of Cycle 14 the San Francisco quake was a dwarf compared with the Cascadia megathrust. The San Franciso earthquake was recorded at about 7.8 on the Richter scale, but was sufficient to kill about 3 000 persons and leave 300 000 homeless. This was the first modern earthquake in the sense of being filmed, being used as the setting for several Hollywood films, and several books. Quantifying what a similar quake would cause, today, as economic damage generates many scenarios but several extend well above $100 billion.
More important for this article, the role and relation of sunspot cycle changes, to Earth seismic, volcanic or tectonic events is far from a science. Anyone trying to argue for a causal linkage will have major problems, for example concerning extreme or megathrust events - such as the Cascadia quake or the Tambora volcano and quake - these have "cycle times" or likely outbreaks every 300 - 500 years. When we look at sunspot cycles, these are only well known and closely observed for 260 years, and less than that when it concerns real scientific detail. The potential or possible mechanisms in play, for example solar events (like CMEs - coronal mass ejections), and the action of compressional and tensional tectonic plates, are large in number and highly controversial as to cause-and-effect.
More easily forecast as a relatively fast-acting, relatively well-proven effect of weak or very weak sunspot cycles we have siginficant changes in seasonal weather trends. The major effect of these weak cycles is cold winters, cool dry springs and warm, short summers. Under some circumstances of sunspot cycle change, resulting from large but not precisely known, porbably cyclic changes in solar nucleosynthetic fission and fusion processes, very large changes in Earth magnetic fields and behaviour can result and usually do result. These changes could or might affct the worl'd tectonic plates.
Linkage between the unknown causes of strong and weak sunspot cycles, Earth weather and climate (and its effect on the economy), and seismic or tectonic activity is not normative scientific, but probabilistic relying on statistical analysis. What we know is that total solar energy ouput variation measured as visible light (with a midpoint at 555 nanometres wavelength), to UV and IR, high energy X-rays and neutrons, and other particles, and magnetic flux can vary about 7% either side of long run averages. For example in the past 100-odd years comparing the lows of Cycle 14 with the peaks of Cycle 19 (1960s), these variations are substantial and can drive major weather and climate changes. If they cause or favour volcano and earthquake events is another question, but can be posited.
By Andrew McKillop
Contact: xtran9@gmail.com
Former chief policy analyst, Division A Policy, DG XVII Energy, European Commission. Andrew McKillop Biographic Highlights
Co-author 'The Doomsday Machine', Palgrave Macmillan USA, 2012
Andrew McKillop has more than 30 years experience in the energy, economic and finance domains. Trained at London UK’s University College, he has had specially long experience of energy policy, project administration and the development and financing of alternate energy. This included his role of in-house Expert on Policy and Programming at the DG XVII-Energy of the European Commission, Director of Information of the OAPEC technology transfer subsidiary, AREC and researcher for UN agencies including the ILO.
© 2013 Copyright Andrew McKillop - All Rights Reserved Disclaimer: The above is a matter of opinion provided for general information purposes only and is not intended as investment advice. Information and analysis above are derived from sources and utilising methods believed to be reliable, but we cannot accept responsibility for any losses you may incur as a result of this analysis. Individuals should consult with their personal financial advisor.
Andrew McKillop Archive |
© 2005-2022 http://www.MarketOracle.co.uk - The Market Oracle is a FREE Daily Financial Markets Analysis & Forecasting online publication.