Stocks Primary Bear Market- Dow Industrials vs Transports
Stock-Markets / Dow Theory Mar 08, 2008 - 06:31 PM GMTBy: Tim_Wood

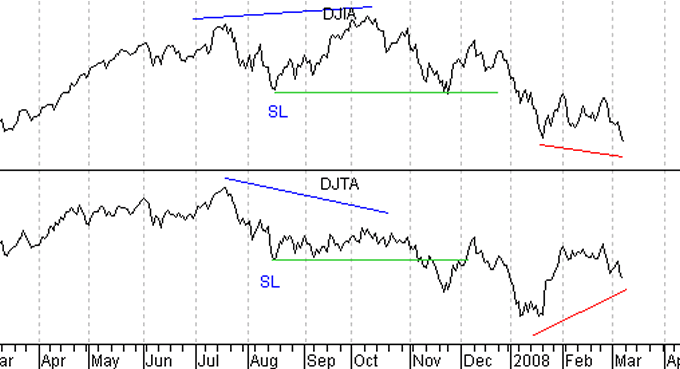
 From a Dow theory perspective, the primary bearish trend confirmation that occurred on November 21, 2007 remains intact. According to Dow theory, it's the close that counts and up until March 7, 2008, the averages have both been operating within the boundaries of the previous two secondary high and low points. According to Dow theory such movement is of no forecasting value. In other words, once the trend is authoritatively established it must be considered to be intact until it is reversed and price movement between two secondary high and low points does not reverse the trend.
Such movement is simply “neutral.” As of March 7, 2008, the Industrials have broken below their previous low. But, the Transports have not. Thus, we now have a non-confirmation between the two averages. This non-confirmation does not invalidate the existing primary bearish trend. It does however put us on notice that something could be trying to change. Let me make it perfectly clear that until such change actually materializes the existing primary bearish trend remains very much intact. This non-confirmation could continue to grow, or it could fail with a break by the Transports below their January low.
As William Peter Hamilton suggested in his Dow theory book titled The Stock Market Barometer in 1922, the Dow theory is a tool to gauge general business conditions. As I'm sure you will all agree, since the Dow theory primary trend change was confirmed on November 21 st , business conditions have indeed deteriorated as has been seen by the steady stream of poor economic news.
I have included the current chart of the Industrials and the Transports below. It was the break below the August secondary low point that served to confirm the primary trend change on November 21 st . The bearish primary trend was further confirmed in January when the averages broke below the November lows. As stated above, the price action between the January lows and March 7, 2008 occurred between the previous secondary high and low points on both averages. With the price action on March 7, 2008 breaking below the January low on the Industrials, we now have a non-confirmation as is noted in red.
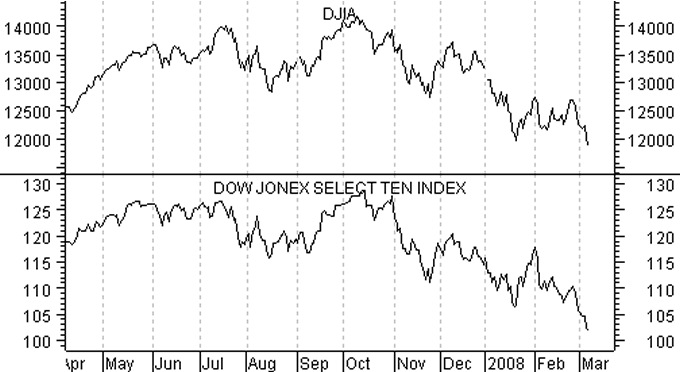
We can also look within these specific averages for additional hints. As an example, I have included a chart of the Industrials along with the Dow Jones Top Ten Index in the lower window of this chart. The Top Ten Index is comprised of the top ten dividend-yielding stocks within the Industrials. Note that this index has now moved below its January low as well. This is telling us that we are seeing a consistent erosion between the Industrials and this subset of the Industrials.
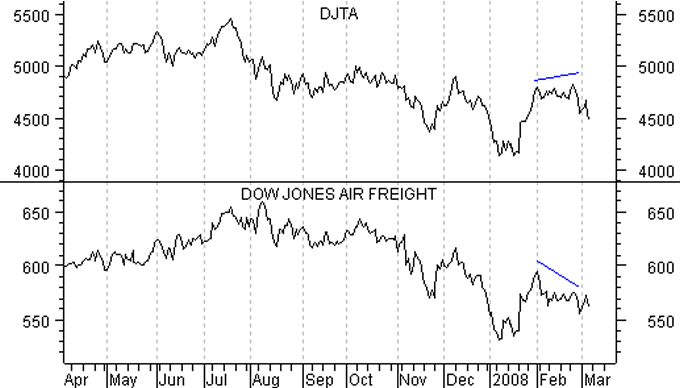
In the next chart below I have included the Transports in the upper window and the Dow Jones Air Freight Index in the lower window. Both of these indexes have bounced approximately the same percentage out of their January lows and like the Transports the Air Freight Index is holding above the January low. But, note that the Air Freight Index has formed a short-term divergence with the Transports. Price has not yet broken down out of this short-term divergence, but the divergence is telling us that we are seeing some degree of deterioration by this subset within the overall Transportation Average.
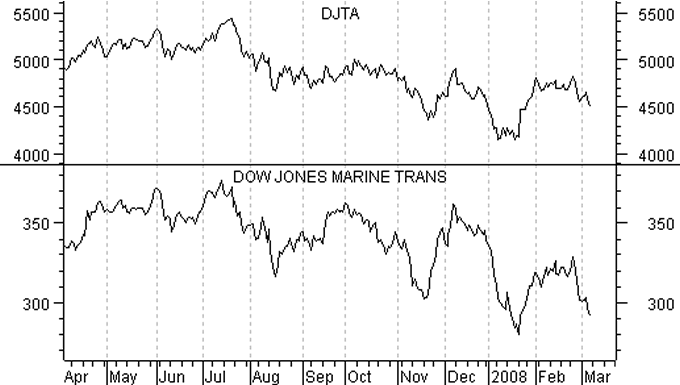
Next, we have a chart of the Transports verses the Dow Jones Marine Index. Here too, the Marine Index bottomed in January along with the Transports. Since that low both of these averages have pretty well confirmed each other. But, we are now seeing the Marine Index showing more relative weakness than the Transports in that it has broken down much further than the Transportation Average itself. Thus, this sub-set of the Transports is weakening.
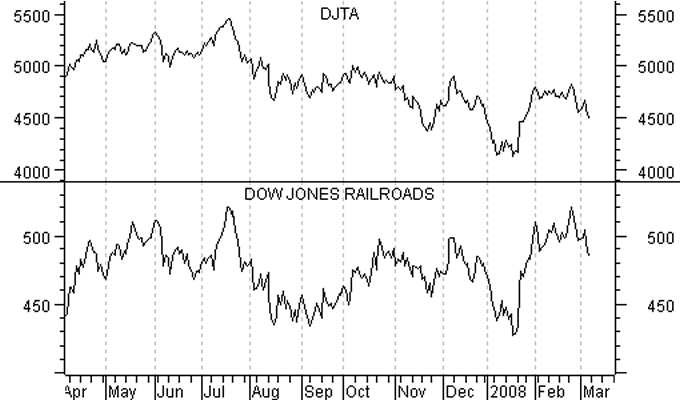
In the next chart below I have again included a chart of the Dow Jones Transportation Average along with a chart of the Dow Jones Railroad Index in the lower window. In this case both averages topped in July and last made a joint low in January. But, in this case the Railroads are showing more relative strength and have recovered nearly to their July high. This is a positive, but this alone does not change anything. It does however show where much of the strength within the Transports is coming from. With the Rails now declining it is important to watch this subset for further erosion.
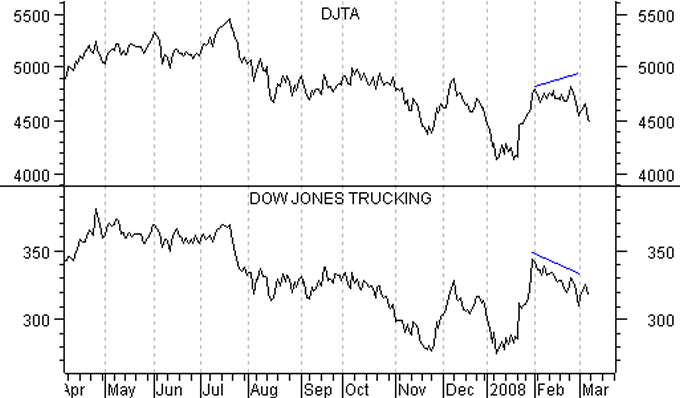
The next sub-sector of the Dow Jones Transportation Average that I have included is the Trucking Index. Here too, these averages deteriorated out of their divergent July top and last made joint lows in January. Again, from those lows, both averages have rallied. In this case, the Truckers have formed a short-term divergence, or non-confirmation, with the overall Transportation Index. So, like the Air Freight Index we are seeing deterioration within the Transportation Average by this subset, but price has not yet broken down out of this divergence.
The bottom line is that the Dow theory primary trend change is still very much intact. Yes, there is now a Dow theory non-confirmation intact. There is no way to know if this non-confirmation will hold or if it will fail. It is for that reason that we must view it as a potential warning, but at the same time we must respect the existing bearish primary bearish trend that is still in force. In the mean time, watching the subsets of the Transports may provide insight as to whether this non-confirmation it going to hold.
From a cyclical perspective, which has absolutely nothing to do with Dow theory, the move into the extended 4-year cycle low remains on track. From my seat, the key to guiding me as we move down into the 4-year cycle low falls on the shoulders of my intermediate-term Cycle Turn Indicator. This indicator is designed to identify important intermediate-term trend changes. This indicator identified the 1929 top and the crash that followed as well as the top of the 1930 rebound and beginning of the decline into the 1932 low. It also called the 1987 top beautifully. At present, I “feel” like the market is holding on by the skin of its teeth. But, if the Cycle Turn Indicator called these other major declines, then odds are it will signal any major decline in the present. Until such time we are operating in an environment with the existing Dow theory primary bearish trend, a Dow theory non-confirmation and the backdrop surrounding the unwinding of this extended 4-year cycle.
I have begun doing free Friday market commentary that is available at www.cyclesman.com/Articles.htm so please begin joining me there. Should you be interested in more in depth analysis that provides intermediate-term turn points utilizing the Cycle Turn Indicator, which has done a fabulous job, on stock market, the dollar, bonds, gold, silver, oil, gasoline, the XAU and more, those details are available in the newsletter and short-term updates. A subscription includes access to the monthly issues of Cycles News & Views covering the Dow theory, and very detailed statistical based analysis plus updates 3 times a week.
By Tim Wood
Cyclesman.com
© 2008 Cycles News & Views; All Rights Reserved
Tim Wood specialises in Dow Theory and Cycles Analysis - Should you be interested in analysis that provides intermediate-term turn points utilizing the Cycle Turn Indicator as well as coverage on the Dow theory, other price quantification methods and all the statistical data surrounding the 4-year cycle, then please visit www.cyclesman.com for more details. A subscription includes access to the monthly issues of Cycles News & Views covering the stock market, the dollar, bonds and gold. I also cover other areas of interest at important turn points such as gasoline, oil, silver, the XAU and recently I have even covered corn. I also provide updates 3 times a week plus additional weekend updates on the Cycle Turn Indicator on most all areas of concern. I also give specific expectations for turn points of the short, intermediate and longer-term cycles based on historical quantification.
Tim Wood Archive |
© 2005-2022 http://www.MarketOracle.co.uk - The Market Oracle is a FREE Daily Financial Markets Analysis & Forecasting online publication.


