Stock Market Rally - There are limits to this Nonsense!
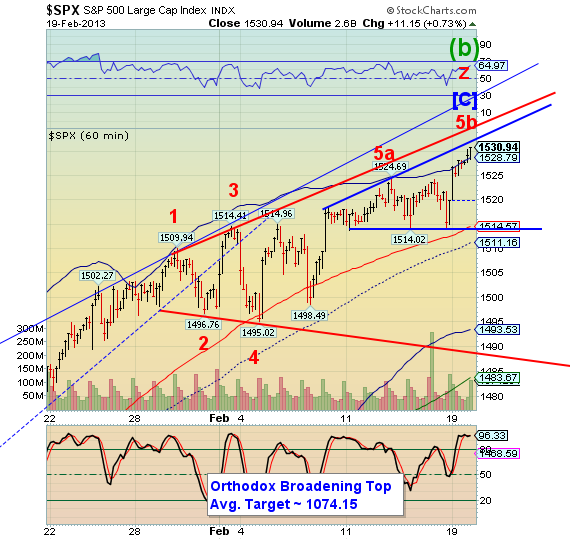
Stock-Markets / Stock Markets 2013 Feb 20, 2013 - 10:50 AM GMT The SPX has developed yet another Broadening Top in the past week. It appears to be putting on the final touches today or tomorrow. It appears that the upper trendline of the latest Megaphone is at 1533 to 1535 tomorrow.
Based on my data so far, the Cycle Clock can pinpoint roughly half of the cycles within a day, while another 30-40% fall within 3-4 days. A small 10-12% fall within 9 days. I don’t have the data tabulated yet, but it seems to be working very well. Tomorrow is day 4 from the Cycle Date, so I will be watching the result along with the rest of you.

Good news, bad news, no news, dips, no dips, who cares. As Goldman sales/trading desk says, never look a gift-Bernanke in the mouth (especially if he ends up in a frozen lasagna at a store near you).
You can take that with a grain of salt.
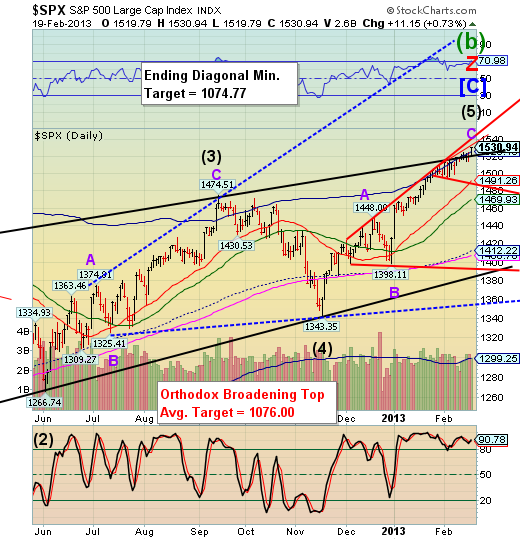
Today the SPX finally threw-over the upper trendline of its massive Ending Diagonal formation. This could really be the end of the road for this huge formation. This is the largest Ending Diagonal in history, to my knowledge. Thomas Bulkowski describes this pattern as a short-term bearish reversal pattern with an average duration up to 3 months. In his book, Encyclopedia of Chart Patterns, he states that this formation rarely exceeds 3 or 4 months in duration (p. 619). The problem is, Intermediate Wave (1) was 129 days, Wave (3) was 102 days and Wave 5 thus far is 95 days in duration while the grand total of the Ending Diagonal so far is 452 days!

What are the limitations before we have to rename this monster? The Primary rule is that Wave (3) cannot be the smallest wave, and since it is already smaller than Wave (1), then Wave (5) cannot exceed Wave (3)s duration of 102 days. We have 7 days left before this entire monstrous entity comes to a screeching halt or blows up. In addition, the length of Wave (3) also cannot be the smallest. It is 207.77 points long, so Wave (5) cannot exceed 1551.12, only 20 points away.
The rule of thumb is that the impulse waves of an Ending Diagonal have a .786 relationship. Wave (3) did just fine, but Wave (5) would have ended at 1506.66 by February 4 if the relationship was followed as I described in my Fibonacci letter. The fact is, it closed at 1507.84 on January 29. It was then that the pattern began morphing into a Broadening Top.
My conclusion is that the Powers That Be are simply trying to kick the can as far as they can. They may not be aware of the structural and Cyclical reasons why this cannot last. So, being unaware of their limitations, they risk a commodity-style reversal and crash with little or no warning. Worse yet, they may be herding investors to the slaughter being fully aware that virtually no one can remain short in this market. However, the Commitment of Traders shows the Commercials are fully short while the mutual funds and hedge funds are 104% long as of last week.
It looks like a powder keg to me!
Regards,
Tony
Our Investment Advisor Registration is on the Web
We are in the process of updating our website at www.thepracticalinvestor.com to have more information on our services. Log on and click on Advisor Registration to get more details.
If you are a client or wish to become one, please make an appointment to discuss our investment strategies by calling Connie or Tony at (517) 699-1554, ext 10 or 11. Or e-mail us at tpi@thepracticalinvestor.com .
Anthony M. Cherniawski, President and CIO http://www.thepracticalinvestor.com
As a State Registered Investment Advisor, The Practical Investor (TPI) manages private client investment portfolios using a proprietary investment strategy created by Chief Investment Officer Tony Cherniawski. Throughout 2000-01, when many investors felt the pain of double digit market losses, TPI successfully navigated the choppy investment waters, creating a profit for our private investment clients. With a focus on preserving assets and capitalizing on opportunities, TPI clients benefited greatly from the TPI strategies, allowing them to stay on track with their life goals
Disclaimer: The content in this article is written for educational and informational purposes only. There is no offer or recommendation to buy or sell any security and no information contained here should be interpreted or construed as investment advice. Do you own due diligence as the information in this article is the opinion of Anthony M. Cherniawski and subject to change without notice.
Anthony M. Cherniawski Archive |
© 2005-2022 http://www.MarketOracle.co.uk - The Market Oracle is a FREE Daily Financial Markets Analysis & Forecasting online publication.
Comments
|
Trader_Joe
20 Feb 13, 18:11 |
Nonsense!
Yes it is nonsense that you have been posting for over 3 years now! |


