


Gold Breaking Support, US Bond Market Crash, Stocks Hitting Resistance
Stock-Markets / Financial Markets 2013 Feb 11, 2013 - 09:44 AM GMTBy: Clive_Maund

 The Big Story now is that there is evidence that powerful forces will be brought to bear shortly to support the ailing US Treasury market, which is close to crashing critical support, and those wielding the power will have no qualms about sacrificing either the commodity markets or the stockmarket to achieve this objective, if necessary. We will look at the outlook for the bond market and stockmarket later, after we have examined the gold charts and indicators.
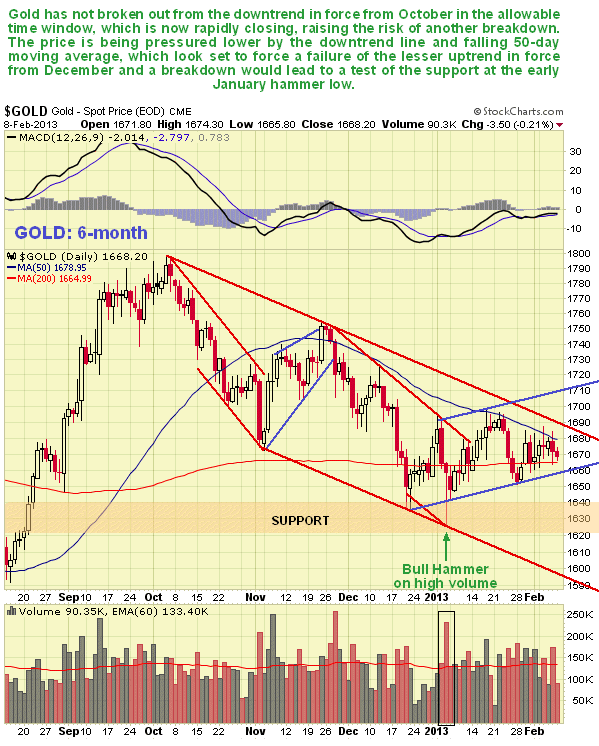
On the 6-month chart for gold we can see that the time window for an upside breakout from the downtrend in force from last October is now rapidly closing, and the downtrend line and falling 50-day moving average, both close by overhead, looks set to force a breakdown soon from the lesser uptrend channel in force from December. The still bearish COT for silver does not help either, since it is unlikely that gold will go up without silver. The big question if gold does break down is whether the support at and near the high volume hammer low of early January will hold. It probably won't, given the way things are shaping up, and if it doesn't gold is heading down to the much more important support level at $1500.
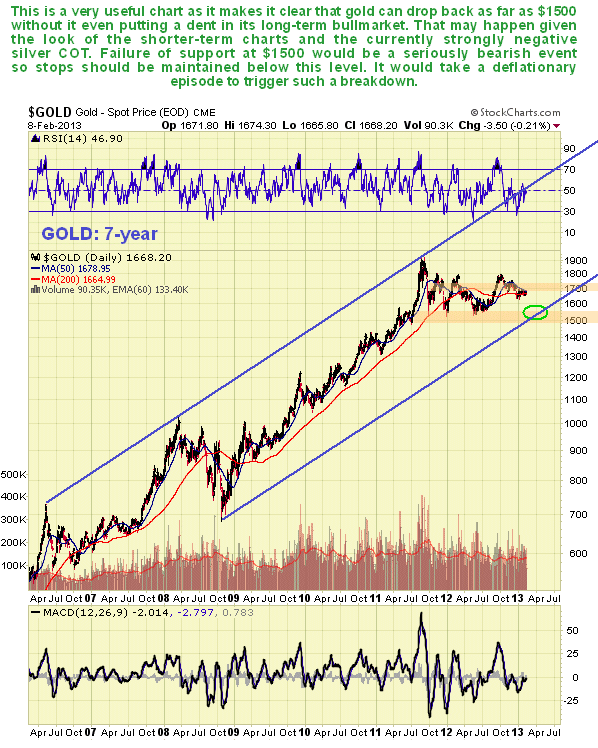
The 7-year chart for gold shown below is very interesting and useful as it reveals that gold can drop back down as far as its lower supporting trendline and crucial strong support at and above $1500, without it even putting a dent in its long-term bullmarket. It is a strong buy as it approaches this support, and a stop can be placed just below it. A breach of this crucial strong support, which has generated 3 reversals to the upside over the past 18 months, would be a seriously negative technical development, which we would expect to be associated with a deflationary scare.
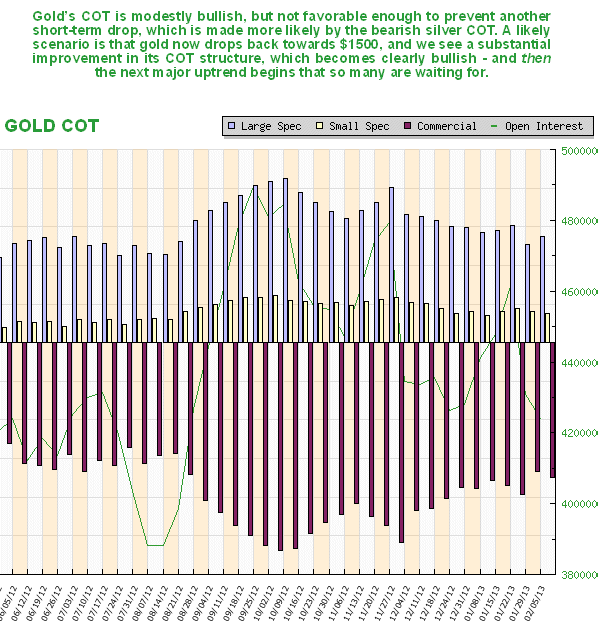
The latest gold COT is modestly bullish, but is not favorable enough to prevent a short-term drop. A likelyscenario is that gold now drops back towards $1500, and we see a substantialimprovement in its COT structure, which becomes clearly bullish - and thenthe next major uptrend begins that so many are waiting for.
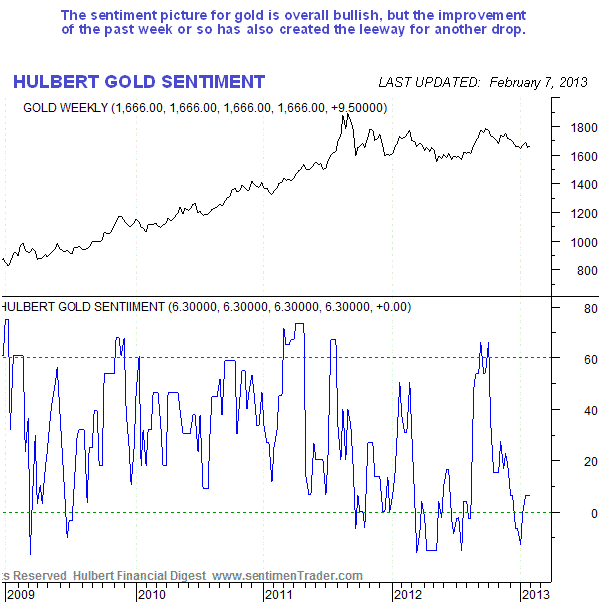
The Hulbert Sentiment index for gold is overall bullish as sentiment remains quite strongly negative, but at the same time the improvement of the past week or so has also created the leeway for another drop.
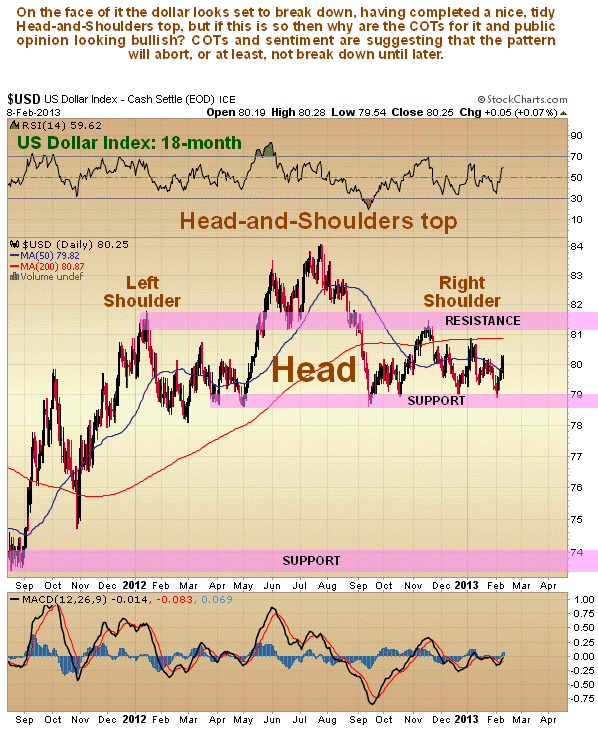
The chart for the US dollar index continues to show a completed Head-and-Shoulders top, but COTs and public opinion on the dollar, the last of which is shown below, are bullish, suggesting that the pattern may abort, or at least not break down for some time to come.
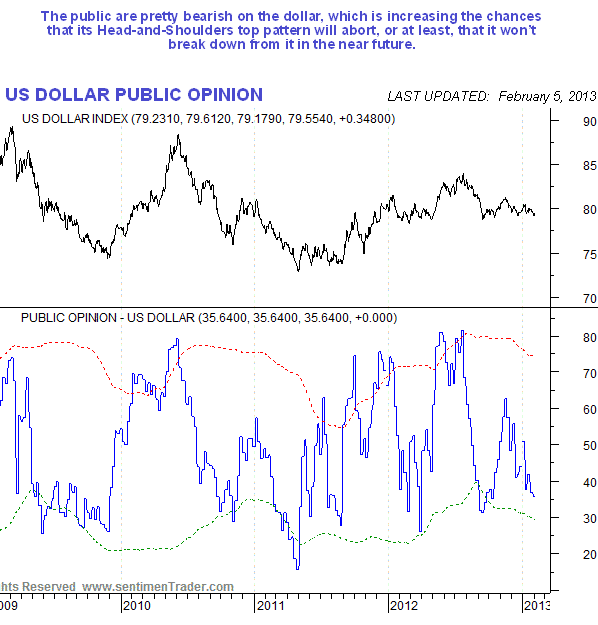
The public are quite bearish on the dollar, which is increasing the chances that the Head-and-Shoulders top in the dollar index will abort.
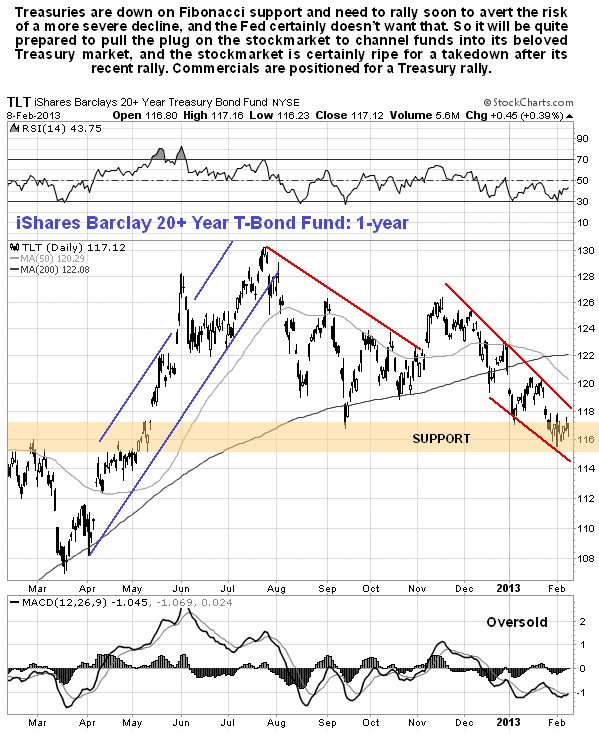
The US Treasury market is the grand aorta of the US economy, which enables the goods and services of the rest of the world to be exchanged for piles of intrinsically worthless paper, thus allowing the US to live way beyond its means. As such, the Fed and US government can be expected to defend it with every means at their disposal. Right now it is under stress after its recent decline and in danger of crashing key support which could trigger a tidal wave of selling, as we can see on the chart below for the proxy iShares Barclays 20+year T-bond Fund. With both the dollar and Treasuries on the verge of tanking, it is clearly time for some really big levers to be pulled, and the most effective way to sluice funds into the dollar and Treasuries is to engineer another deflationary scare involving pulling the plug on the commodity and stockmarkets, and given the vastly greater importance of the Treasury market, the Fed would have no qualms about doing this. Such a scare would also provide a politically favorable environment for cranking up QE to even greater levels. While this is only a theory at this point, the logic behind it is plain - and it explains the current positions held by the powerful Commercials, who are at the top of the market food chain.
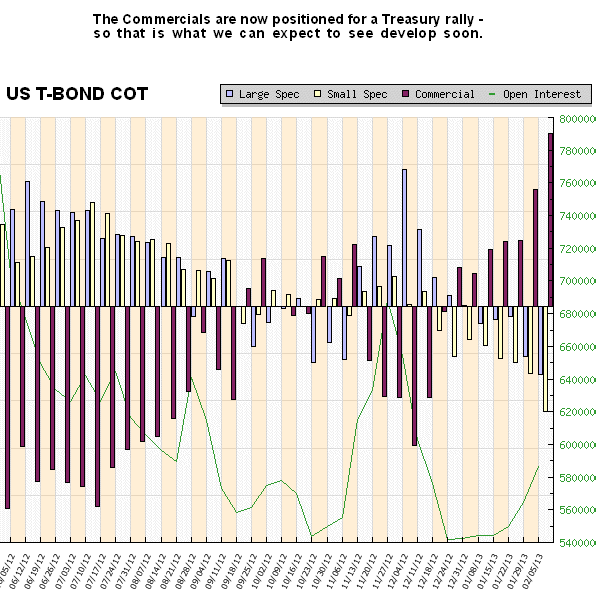
As we can see below on the latest T-bond COT chart, the Commercials are now positioned to benefit from a T-bond rally - isn't it nice to have friends in high places?
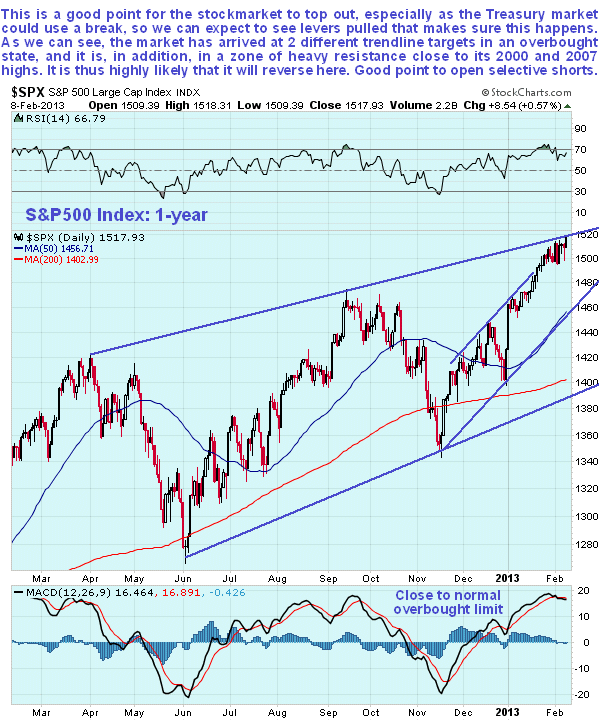
Finally, we can see that this is an excellent point for the broad stockmarket to turn down on the 1-year chart for the S&P500 index shown below, as it has arrived synchronously at 2 different trend channel targets in an overbought state, and is, in addition, in a zone of major resistance close to its 2000 and 2007 highs.
By Clive Maund
CliveMaund.com
For billing & subscription questions: subscriptions@clivemaund.com
© 2013 Clive Maund - The above represents the opinion and analysis of Mr. Maund, based on data available to him, at the time of writing. Mr. Maunds opinions are his own, and are not a recommendation or an offer to buy or sell securities. No responsibility can be accepted for losses that may result as a consequence of trading on the basis of this analysis.
Mr. Maund is an independent analyst who receives no compensation of any kind from any groups, individuals or corporations mentioned in his reports. As trading and investing in any financial markets may involve serious risk of loss, Mr. Maund recommends that you consult with a qualified investment advisor, one licensed by appropriate regulatory agencies in your legal jurisdiction and do your own due diligence and research when making any kind of a transaction with financial ramifications.
Clive Maund Archive |
© 2005-2022 http://www.MarketOracle.co.uk - The Market Oracle is a FREE Daily Financial Markets Analysis & Forecasting online publication.