


What Past and Future Speculative Bubbles Indicate for Gold and Silver!
Commodities / Gold and Silver 2013 Jan 28, 2013 - 06:16 PM GMTBy: DeviantInvestor

 This is not a prediction of future prices of gold and silver; it is an indication of what could happen in a speculative bubble environment based on the history of previous bubbles.
I’ll summarize a simple analysis of past bubbles.
 Definitions
- Bubble: A speculative mania in a market that is priced well beyond what the fundamentals and intrinsic value indicate.
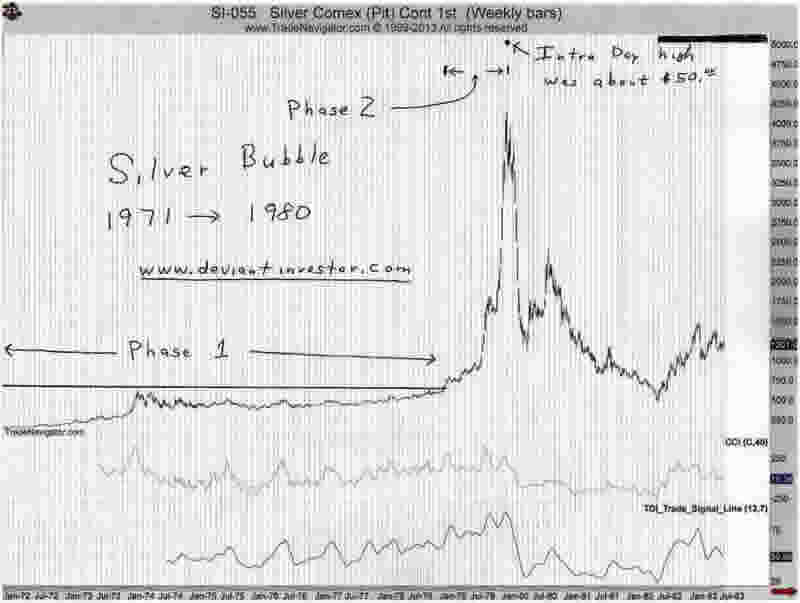
- Phase 1: The first phase of the bubble begins with the price bottoming and initiating a long rally. It is often indicated by a triggering event such as Nixon closing the “gold window” on August 15, 1971 – the beginning of the gold and silver bubbles that terminated in 1980. The market rallies for some years, hits a new “all-time” high, and then corrects.
- Phase 2: The final phase of the bubble starts when the price exceeds the “new high” and then rallies to a much higher and unsustainable level.
When the market proceeds into a bubble phase, it rallies beyond that new high and continues much higher. The end of phase 1 and the beginning of phase 2 are the point at which the market rallies from its correction low and exceeds its previous high. See the graph of the silver market with the indicated beginning and end points for phase 1 and phase 2.
I looked at the time and price data for the South Sea Bubble in England from 1719 -1720, the silver bubble from August 1971 to January 1980, the NASDAQ bubble from August 1982 to March 2000, the Japanese Real Estate bubble from 1965 to 1991, the gold bubble from August 1971 to January 1980, and the S&P mini-bubble from August 1982 to March of 2000. A spreadsheet will not display well, so I’ll list my results. Please realize that all prices and dates are approximate – this is “big picture” analysis.
The conclusion is that bubbles start slowly and then accelerate to unsustainable highs (on large volume) that are largely created by greed and fear but not fundamental evaluations. Bubbles generally follow the “Pareto Principle” where approximately 80% of the price move occurs in the LAST 20% of the time. Consider:
South Sea Bubble: (Extreme price bubble)
- Phase 1: January 1719 to March 1720. Price from $120 to $180.
- Phase 2: March 1720 to July 1720. Price from $180 to $900.
- Time: Phase 1 – 75%, phase 2 – 25%.
- Price: Phase 1 – 8%, phase 2 – 92%. Phase 2 price ratio: 5
Silver Bubble: (Extreme price bubble)
- Phase 1: August 1971 to March 1978. Price from $1.50 to $6.40.
- Phase 2: March 1978 to January 1980. Price from $6.40 to $50.
- Time: Phase 1 – 78%, phase 2 – 22%.
- Price: Phase 1 – 10%, phase 2 – 90%. Phase 2 price ratio: 7.8
NASDAQ Bubble: (Extreme price bubble)
- Phase 1: August 1982 to February 1995. Price from $168 to $780.
- Phase 2: February 1995 to March 2000. Price from $780 to $4,880.
- Time: Phase 1 – 71%, phase 2 – 29%.
- Price: Phase 1 – 13%, phase 2 – 87%. Phase 2 price ratio: 6.3
Japanese Real Estate Bubble: (approximate numbers)
- Phase 1: 1960 to 1979. Price Index from 4 to 50.
- Phase 2: 1979 to 1991. Price Index from 50 to 225.
- Time: Phase 1 – 61%, phase 2 – 39%.
- Price: Phase 1 – 21%, phase 2 – 79%. Phase 2 price ratio: 4.5
Gold Bubble:
- Phase 1: August 1971 to July 1978. Price from $40 to $200.
- Phase 2: July 1978 to January 1980. Price from $200 to $870.
- Time: Phase 1 – 82%, phase 2 – 18%.
- Price: Phase 1 – 19%, phase 2 – 81%. Phase 2 price ratio: 4.4
S&P Bubble: (Mini-bubble)
- Phase 1: August 1982 to February 1995. Price from $100 to $483.
- Phase 2: February 1995 to March 2000. Price from $483 to $1,574.
- Time: Phase 1 – 71%, phase 2 – 29%.
- Price: Phase 1 – 26%, phase 2 – 74%. Phase 2 price ratio: 3.3
Summary
Bubbles tend to follow the 80/20 ratio indicated in the Pareto Principle. Phase 1 takes approximately 70-80% of the time and covers approximately 10-20% of the total price change. Phase 2 accelerates so that it takes only 20-30% of the time but covers 80-90% of the price change. Extreme bubbles such as the South Sea Bubble and the Silver bubble experience approximately 90% of the price change in the 2nd phase. The ratio of the phase 2 ending price to beginning price is typically 4 to 8 – a huge price move. Such bubbles are rare; the subsequent crash is usually devastating.
Future Bubbles
In the opinion of many analysts, sovereign debt is an ongoing bubble that could burst with world-wide consequences. Should deficit spending and bond monetization (Quantitative Easing) accelerate in the next several years, as seems likely, that sovereign debt bubble will inflate further. Because of the massive printing of dollars, the value of the dollar must fall, particularly against commodities such as oil, gold, and silver. As the purchasing power of the dollar falls, an increasing number of people will realize their dollars are losing value, and those people will seek safety for their savings and retirement. Gold and silver will benefit from an increasingly desperate search for safety as a result of the decline of the dollar. Assuming the 80/20 “rule” and the phase 2 price change ratio of approximately 5, what could happen if gold and silver rise into another speculative bubble?
Assume that silver began its uptrend in November 2001 at $4.01 and that gold began its move in April 2001 at $255. Silver rallied to nearly $50 in 2011, and gold also rallied to a new high of about $1,900 in 2011. Assume that both surpass those highs about mid-2013 and accelerate into phase 2 thereafter. Using these assumptions, phase 1 for silver would measure 12.5 years and phase 2 could last until approximately late 2016 – early 2017. If we assume that phase 1 was a move from $4 to $50 and that represents 19% of the total move, the high could be around $250. The ratio of phase 2 ending price to beginning price would be 5:1 – reasonable.
Indications for gold suggest a similar end date and a phase 2 bubble price of perhaps $9,000 per ounce. The ratio of phase 2 ending price to beginning price would be 4.7:1 at $9,000.
The gold to silver ratio at these bubble prices would be approximately 36, much higher than the ratio from 1980. Perhaps silver would “blow-off” higher, like it did in 1980, and force the gold to silver ratio lower or perhaps gold might not rally so high. Time will tell.
Outrageous?
Well, yes, at first glance, those prices do seem outrageous. But consider for perspective:
- Apple stock rose from about $4 in 1997 to over $700 in 2012.
- Silver rose from $1.50 to $50.00 in less than 10 years.
- Gold rose from about $40 to over $850 in less than 10 years.
- Crude oil rose from less than $11 in 1998 to almost $150 in 2008.
- The official US national debt is larger than $16,000,000,000,000. The unfunded liabilities, depending on who is counting, are approximately $100,000,000,000,000 to $230,000,000,000,000. Divide $200 Trillion by approximately 300,000,000 people and the unfunded debt per capita of the United States is approximately $700,000. That is outrageous!
- The official national debt increases in excess of $3,000,000,000 per day, each and every day. The unfunded liabilities increase by perhaps five – ten times that amount. Outrageous!
- We still pretend the national debt is not a problem and that it will be “rolled over” forever. That is outrageous.
- Argentina has revalued their currency several times in the last 30 years – they have dropped 8 zeros off their currency since 1980. Savings accounts and the middle class were devastated several times. It can happen again.
Given the above for perspective, is gold at $5,000 to $10,000 per ounce unreasonable or impossible? Is silver at $200 to $400 per ounce unreasonable or impossible? Past bubbles have had an ending price 4 – 8 times higher than the phase 2 beginning price, so history has shown that such prices for gold and silver are indeed possible. Possible is not the same as certain – but these bubble price indications are certainly worth your consideration.
Would you prefer your savings in gold, silver, or a savings account? Read Ten Steps to Safety.
GE Christenson
aka Deviant Investor
If you would like to be updated on new blog posts, please subscribe to my RSS Feed or e-mail
© 2013 Copyright Deviant Investor - All Rights Reserved Disclaimer: The above is a matter of opinion provided for general information purposes only and is not intended as investment advice. Information and analysis above are derived from sources and utilising methods believed to be reliable, but we cannot accept responsibility for any losses you may incur as a result of this analysis. Individuals should consult with their personal financial advisors.
© 2005-2022 http://www.MarketOracle.co.uk - The Market Oracle is a FREE Daily Financial Markets Analysis & Forecasting online publication.