


Crude Oil and Energy Stocks Trend Forecast
Commodities / Crude Oil Jan 28, 2013 - 03:42 PM GMTBy: Chris_Vermeulen

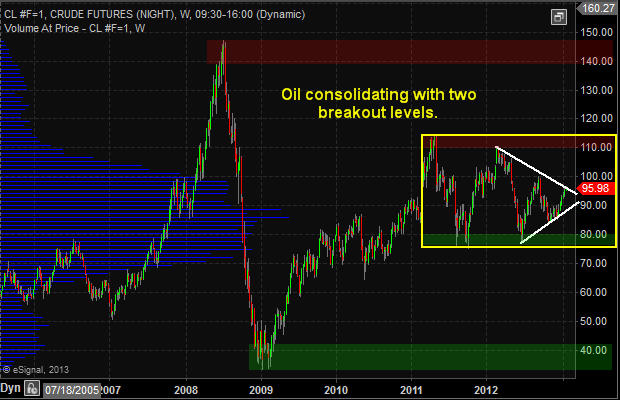
 Crude oil has been trading ways for the past year between the 2011 high and low. The trading range through 2012 has been contracting with a series of lower highs and higher lows. This pennant formation because it is taking place after an uptrend is a bullish pattern with $110 and possibly even $140+ per barrel in the next 6-18 months.
If you look at the weekly investing chart of crude oil the key support and resistance levels area clearly marked. A breakout of the white pennant will trigger a move to the next support or resistance level. And judging from the positive economic numbers not only form the USA but globally the odds are increased for the $110+ price target to be reached sooner than later.
Crude Oil Price Chart – Weekly Investing
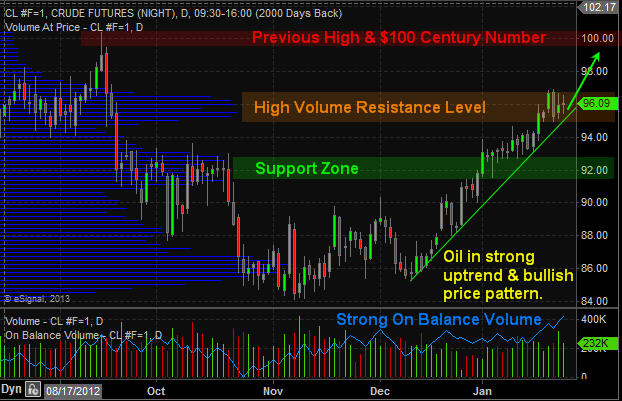
Crude Oil Price Chart – Daily short term Analysis & Target
If we zoom into the daily chart and analyze price and volume you will notice the $100 per barrel level is potentially only 2-3 days way… But keep in mind whole numbers (decade & Century Numbers) naturally act as support and resistance levels. So when the $100 century price is reached there will be a wave of sellers with fat thumbs who will slam the price back down to the $96 and possibly back down to the $92 level before oil continues higher.
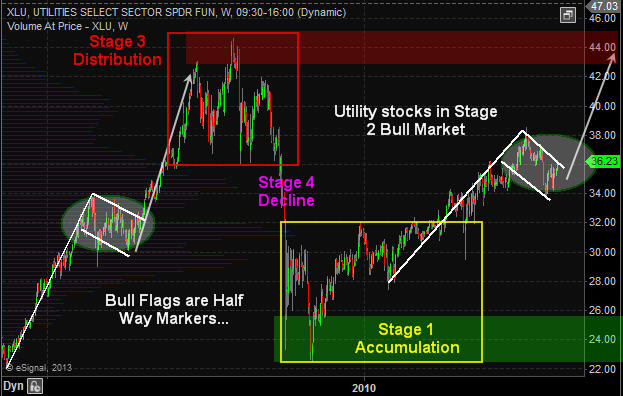
Utility Stocks – XLU – Weekly Investing Chart
The utility sector has done well and continues to look very bullish for 2013. This high dividend paying sector is liked by many and the price action speaks for its self… Keep in mind you can view my actual watchlist of stock and ETFs I trade in real-time with my analysis free: https://stockcharts.com/public/1992897
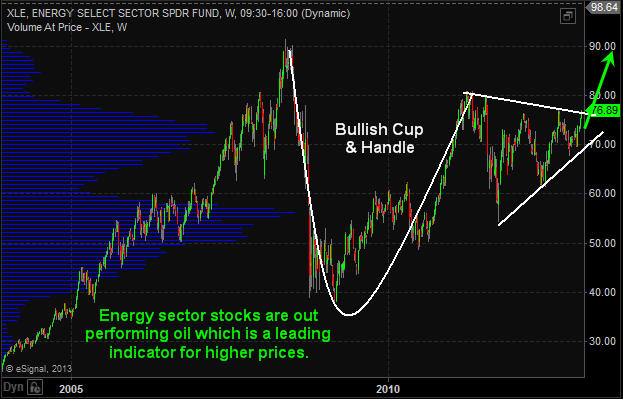
Energy Sector Weekly Investing Chart
Energy stocks which can be followed using the XLE exchange traded fund (ETF) typically leads the price of oil. Looking at energy stocks we can see that they are outperforming the price of crude oil and on the verge of breaking out of a large Cup & Handle pattern. If so then $90 is the next stop but prices may go much higher in the long run.
Energy Stocks and Crude Oil Conclusion:
In short, crude oil is stuck in a large trading range much like gold and silver which I just wrote about here: http://www.thegoldandoilguy.com/articles/precious-metals-miners-making-waves-and-new-trends/
Once a breakout takes place on either the white or yellow lines on the first crude oil weekly chart we should see oil, energy and utility stocks start making some big moves. Depending on the direction of the breakout (Up or Down) it must be played in that direction to generate substantial profits obviously.
If you would like to keep up to date on market trends and trade ideas be sure to join my newsletter at http://www.thegoldandoilguy.com
By Chris Vermeulen
Please visit my website for more information. http://www.TheGoldAndOilGuy.com
Chris Vermeulen is Founder of the popular trading site TheGoldAndOilGuy.com. There he shares his highly successful, low-risk trading method. For 7 years Chris has been a leader in teaching others to skillfully trade in gold, oil, and silver in both bull and bear markets. Subscribers to his service depend on Chris' uniquely consistent investment opportunities that carry exceptionally low risk and high return.
This article is intended solely for information purposes. The opinions are those of the author only. Please conduct further research and consult your financial advisor before making any investment/trading decision. No responsibility can be accepted for losses that may result as a consequence of trading on the basis of this analysis.
Chris Vermeulen Archive |
© 2005-2022 http://www.MarketOracle.co.uk - The Market Oracle is a FREE Daily Financial Markets Analysis & Forecasting online publication.