


Importance of the Ratio of Leadership Stocks to the Broad Market For Stock Market Trends
Stock-Markets / US Stock Markets Feb 28, 2008 - 02:03 PM GMTBy: Marty_Chenard

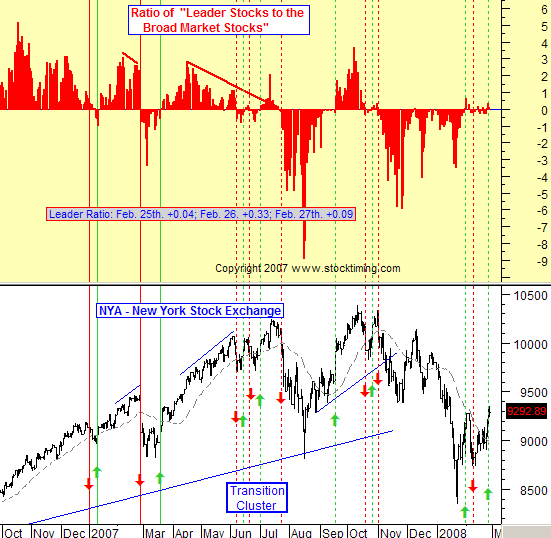
 Background : All sustainable and hold-able rallies have one thing in common. The Ratio of Leadership Stocks to the Broad Market is always positive and trending up to a high level. Simply look at the red bar graph below ... see when it was positive, and then look down at the NYA Index and you will see that these times all represented great upside rallies.
A high Leadership Stock Ratio infers that Leadership Stocks are growing in numbers and trending higher. When the ratio number outweighs the number of down trending stocks, then the Leadership stocks are "pulling the market up".
February 28th. Reading : Note the movement and momentum of the red Leadership Ratio bars on the chart below. Strong up trends and high reading always gives you a strong upside rally. Strong down trends always gives you a pull back or correction.
So what do we have now? Neither . Note that the Leadership Ratio has not been trending in any direction during the past few weeks. Instead, we have been seeing oscillating Ratio readings that are slightly positive or slightly negative ... ratio readings have been essentially hugging the neutral zero line .
Today's Comment : In the past few days, the market has been going up while the Leadership stock ratios have been flat and close to neutral. This is a negative divergence coming from Leadership stocks. It means that the sustainability of this up move is in question unless we start to see the Leadership Stock Ratio move much higher ... real soon.
(The Leadership Stock Ratios are posted every day on our paid subscriber sites. This chart will NOT be posted again on this free site during the next two weeks.)
My Best, Personal "non-stock" Tip for 2008 ... it will save you from wasting a lot of time , it will eliminate a huge source of frustration , and protect you at the same time.
What is it? See this link for my answer: My 2008 Best Personal Tip .
By Marty Chenard
http://www.stocktiming.com/
Please Note: We do not issue Buy or Sell timing recommendations on these Free daily update pages . I hope you understand, that in fairness, our Buy/Sell recommendations and advanced market Models are only available to our paid subscribers on a password required basis. Membership information
Marty Chenard is the Author and Teacher of two Seminar Courses on "Advanced Technical Analysis Investing", Mr. Chenard has been investing for over 30 years. In 2001 when the NASDAQ dropped 24.5%, his personal investment performance for the year was a gain of 57.428%. He is an Advanced Stock Market Technical Analyst that has developed his own proprietary analytical tools. As a result, he was out of the market two weeks before the 1987 Crash in the most recent Bear Market he faxed his Members in March 2000 telling them all to SELL. He is an advanced technical analyst and not an investment advisor, nor a securities broker.
Marty Chenard Archive |
© 2005-2022 http://www.MarketOracle.co.uk - The Market Oracle is a FREE Daily Financial Markets Analysis & Forecasting online publication.