


The Santa Clause Cliff, Stock Market Forecast 2013
Stock-Markets / Stock Markets 2013 Dec 21, 2012 - 10:51 AM GMTBy: Gordon_T_Long

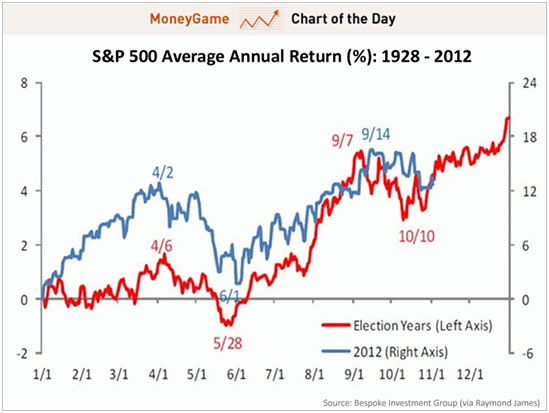
 The chart to the right shows the average annual percentage return during election years. This chart has been a surprisingly accurate guide since spring, but this about to change!
Looking forward at the average post election year cycle, as shown on the chart below, it gives us a better view of what typically occurs in the weeks leading up to and after the January inauguration. Additionally, the analogy shows how 2013 might possibly unfold.
We have labeled an ellipse "A" on the post election analogy which maps to our analytic work which follows and uses Elliptical Fibonacci patterns.
We can see that the lift from the beginning of November seems to be fitting well in to an ellipse. This is suggesting that we will continue to see an overall lift in to the beginning of 2013. While an increase in volatility will be evident with the Fiscal Cliff drama. It likely won’t be until the end of February until we see the and start down the back side of our ellipse.
After the March quadruple could possibility see another lift, back to the top of the larger ellipse pattern shown on our big picture ellipse chart.
The Next 3 Months
The Big Picture
The chart below shows us the S&P from the market low in 2009. The recent lift appears to be fitting nicely in to a larger ellipse pattern, which is almost always the case when the ellipse has been identified properly.
It’s important to note, if the analogy continues to hold we have a some bleak years ahead. The market is reaching the apex of the ellipse and will take a couple of years to move over to the right hand side. Moves across the top of an ellipse are usually violent with increasing volatility.
Throughout this period there will be increasing panic and every down will elicit calls from the “main stream” that we are having a “crash”, “the top is in” and “it’s time to stand aside”. Then, as soon as it appears like it the ultimate crash is inevitable, the market will lift back to the top of the ellipse. It appears as if we may see this go on until then end of 2015 as on-going monetary money printing, fiscal "Kick the Can Down the Road" polices and "knee jerk" public policy keeps hope aliive.
Eventually, all this will end badly. The charts are clear about what lies ahead based on our current path.
Is there any precedent for the Ellipse Pattern?
Ellipses and the attendant Fibonacci Spirals can be found everywhere within the markets, and we have seen similar structures during similar months in previous years. This month's Triggers edition lays this out.
Good luck, and good trading.
Download your FREE TRIAL copy of the latest TRIGGER$ Checkout the GordonTLong.com YouTube Channel for the latest Macro Analytics from expert Guests
Gordon T Long Publisher & Editor general@GordonTLong.com
Gordon T Long is not a registered advisor and does not give investment advice. His comments are an expression of opinion only and should not be construed in any manner whatsoever as recommendations to buy or sell a stock, option, future, bond, commodity or any other financial instrument at any time. While he believes his statements to be true, they always depend on the reliability of his own credible sources. Of course, he recommends that you consult with a qualified investment advisor, one licensed by appropriate regulatory agencies in your legal jurisdiction, before making any investment decisions, and barring that you are encouraged to confirm the facts on your own before making important investment commitments. © Copyright 2012 Gordon T Long. The information herein was obtained from sources which Mr. Long believes reliable, but he does not guarantee its accuracy. None of the information, advertisements, website links, or any opinions expressed constitutes a solicitation of the purchase or sale of any securities or commodities. Please note that Mr. Long may already have invested or may from time to time invest in securities that are recommended or otherwise covered on this website. Mr. Long does not intend to disclose the extent of any current holdings or future transactions with respect to any particular security. You should consider this possibility before investing in any security based upon statements and information contained in any report, post, comment or suggestions you receive from him.
Gordon T Long Archive |
© 2005-2022 http://www.MarketOracle.co.uk - The Market Oracle is a FREE Daily Financial Markets Analysis & Forecasting online publication.