


Stock Market Santa Tries to “Sleigh” the Fiscal Cliff
Stock-Markets / Stock Markets 2012 Dec 13, 2012 - 09:47 AM GMTBy: PhilStockWorld

 Courtesy of Sabrient Systems and Gradient Analytics writes: Santa Claus is trying his hardest to keep spirits bright among stock investors. But the President and the House are not playing nice and just might find a lump of coal in their stockings. Neither appears willing to give an inch, so some observers predict that we will indeed go over the fiscal cliff, at least until mid-January. Then, with across-the-board tax increases and spending cuts in place, the politicians can be seen as having restored tax cuts for most of us rather than seen as making the marginal rates on some of us go up.
Let’s review some key dates. First, December 17 is when the President is scheduled to start his vacation, so theoretically a budget deal needs to be struck by then. Unfortunately, I haven’t been hearing anything about Clinton-style late night phone calls to cajole congress into hammering out some kind of compromise deal. Rallying support from the public is not the same thing. Conservatives are often called evil-doers for wanting to cut spending on “sacred” programs, but today more than ever before, someone has to be the grown-up and say no. Governing a debt-ridden nation is hard work. Just look at what the eurozone is going through. Continuing to be the good guy by saying yes to everyone’s pet program is no longer an option.
The U.S. overall has largely avoided the really big discomfort so far because we are in the singular position of being able to print money without causing inflation. But more debt is not a long-term answer. It has always been Fed Chairman Bernanke’s plan to eventually shrink the balance sheet back down to normal levels. Stimulus is intended to help push up revenues, create jobs, and thus reduce the need for entitlements like jobless claims, but spending cuts ultimately will be necessary to make any major impact on the deficit. On Wednesday, Bernanke announced a new round of stimulus in the face of a still-shaky economic recovery, and he said that the Fed would keep interest rates near zero until the unemployment rate falls below 6.5%, as long as inflation remains below 2.5%.
The next date of interest is December 21 and what some say is the Mayan Prophecy end of days. It will be a very Merry Christmas indeed if the black hole doesn’t suck up the Earth or floods don’t engulf us all. There’s no materialism in that Christmas wish.
If we all wake up on Saturday, December 22, then it will back to reality. But first there is the Christmas break on Monday and Tuesday before the cliff kicks in on January 1.
The market has been impressively resilient given the huge cloud of uncertainty. Exceptions include Apple (AAPL) which has fallen substantially in what many are calling tax-related selling in to lock in capital gains at the lower tax rates we have today.
But if a deal can get done—even if it is sometime during January—many insiders think that the economy is primed to roar. It might be worthwhile to buy some February call options on a market index, as a lottery ticket.
The charts got more bullish this past week as investors begin to position in anticipation of a budget deal. The S&P 500 SPDR Trust (SPY) closed Wednesday at 143.51, confirming its break above strong overhead resistance at both the 50-day simple moving average and prior support-turned-resistance at 143. A bullish rising channel looks to be forming, and the upper line of the channel appears to be converging with the prior triple-top resistance near 147. Oscillators RSI, MACD, and Slow Stochastic are all providing little guidance as they cycle back and forth within the trading noise.
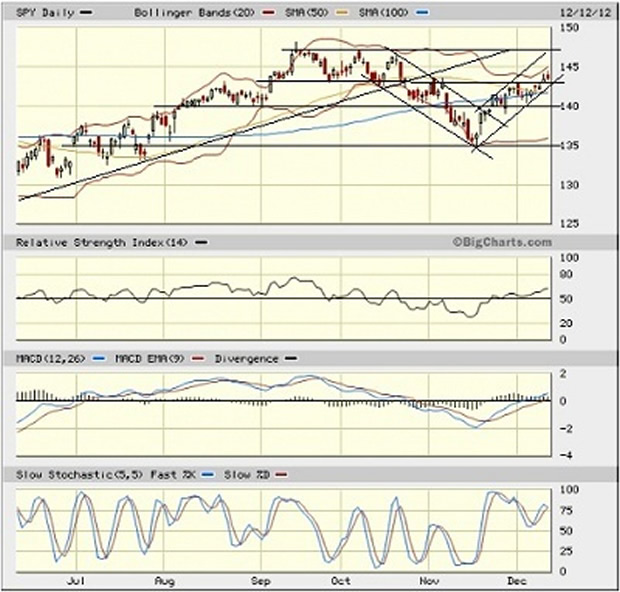
The CBOE Market Volatility Index (VIX), a.k.a. “fear gauge,” closed Wednesday at 15.95, which is down further from last week and still well below the important 20 level, reflecting no apparent fear.
By the way, Sabrient Systems and subsidiary Gradient Analytics have launched their long awaiting Earnings Quality Rank (EQR)—a quantitative model based on Gradient’s qualitative forensic accounting screening factors—and the test results are even more impressive than we had hoped. EQR offers broad high-level coverage of over 3,000 stocks from a quality of earnings perspective. It can be used by a fundamental analyst to scan a universe for short ideas or for evaluating stocks in his portfolio or on her radar screen, or it can be used by a quant analyst as a value-added input to his own quant model. Here is a link to the press release:
http://finance.yahoo.com/news/sabrient-launches-earnings-quality-rank-140000050.html
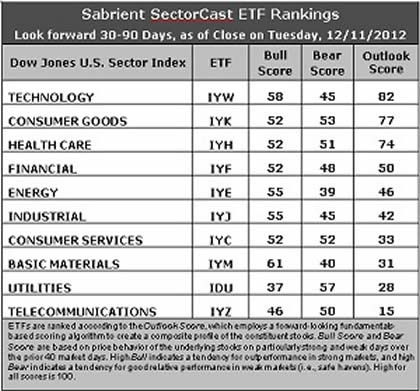
Latest rankings: The table ranks each of the ten U.S. industrial sector iShares (ETFs) by Sabrient’s proprietary Outlook Score, which employs a forward-looking, fundamentals-based, quantitative algorithm to create a bottom-up composite profile of the constituent stocks within the ETF. In addition, the table also shows Sabrient’s proprietary Bull Score and Bear Score for each ETF.
High Bull score indicates that stocks within the ETF have tended recently toward relative outperformance during particularly strong market periods, while a high Bear score indicates that stocks within the ETF have tended to hold up relatively well during particularly weak market periods. Bull and Bear are backward-looking indicators of recent sentiment trend.
As a group, these three scores can be quite helpful for positioning a portfolio for a given set of anticipated market conditions.
Observations:
1. Little change in the rankings this week. Technology (IYW) stays in the top spot with an Outlook score of 82. IYW still shows the best long-term growth rate, forward P/E, and return ratios. Consumer Goods (IYK) continues to hold the best analyst score and sports solid return ratios in its own right, reflected in its Outlook score of 77. Healthcare (IYH) stays in third place at 74, and then there is once again a rather large 24-point gap down to Financial (IYF) in fourth place with a modest score of 50.
2. Telecom (IYZ) stays in the cellar with an Outlook score of 15, and is joined in the bottom two this week by Utilities (IDU) with a 28. Stocks within IYZ appear overvalued from the standpoint of the forward P/E and lack analyst support.
3. Overall, I continue to characterize the fundamentals-based Outlook rankings as neutral, with aggressive and defensive sectors mixed about in the rankings. Only three sectors score above 50, and two of those are defensive (non-cyclical) sectors (IYK and IYH). All of this continues to reflect uncertainty about economic growth and the Federal budget negotiations.
4. Looking at the Bull scores, Materials (IYM) is the clear leader on strong market days, scoring 61. Utilities (IDU) is the clear laggard on strong market days, scoring 37. In other words, Materials stocks have tended to perform the best when the market is rallying, while Utilities stocks have lagged.
5. Looking at the Bear scores, Utilities (IDU) is the clear investor safe haven on weak market days, scoring 57. Energy (IYE) is now the weakest during market weakness, as reflected in its low Bear score of 39, followed closely by Materials (IYM) at 40. In other words, Energy and Materials stocks have been selling off the most lately when the market is pulling back, while Utilities stocks have held up the best.
6. Overall, Technology (IYW) now shows the best all-weather combination of Outlook/Bull/Bear scores. Adding up the three scores gives a total of 185. Telecom (IYZ) is by far the worst at 111. As for Bull/Bear combination, Consumer Goods (IYK) has the best score at 105, while Energy (IYE) and Utilities (IDU) share the worst at 94.
These scores represent the view that the Technology and Consumer Goods sectors may be relatively undervalued overall, while Telecom and Utilities sectors may be relatively overvalued based on our 1-3 month forward look.
Top-ranked stocks within IYW and IYK include Tech Data (TECD), Cerner (CERN), NVR Inc. (NVR), and The J.M. Smucker Company (SJM).
By the way, Sabrient subsidiary Gradient Analytics, whose team of analysts performs in-depth analysis of forensic accounting, earnings quality, and equity incentives, primarily to sniff out red flags, had some strong performers among their negative ratings this earnings season. Diodes (DIOD), Tiffany & Co. (TIF), CLARCOR (CLC), Jos. A Bank Clothiers (JOSB), and The Men’s Wearhouse (MW) are examples of stock identified as at-risk that fell substantially after their earnings reports.
Disclosure: Author has no positions in stocks or ETFs mentioned.
About SectorCast: Rankings are based on Sabrient’s SectorCast model, which builds a composite profile of each equity ETF based on bottom-up aggregate scoring of the constituent stocks. The Outlook Score employs a fundamentals-based multi-factor approach considering forward valuation, earnings growth prospects, Wall Street analysts’ consensus revisions, accounting practices, and various return ratios. It has tested to be highly predictive for identifying the best (most undervalued) and worst (most overvalued) sectors, with a 1-3 month forward look.
Bull Score and Bear Score are based on the price behavior of the underlying stocks on particularly strong and weak days during the prior 40 market days. They reflect investor sentiment toward the stocks (on a relative basis) as either aggressive plays or safe havens. So, a high Bull score indicates that stocks within the ETF have tended recently toward relative outperformance during particularly strong market periods, while a high Bear score indicates that stocks within the ETF have tended to hold up relatively well during particularly weak market periods.
Thus, ETFs with high Bull scores generally perform better when the market is hot, ETFs with high Bear scores generally perform better when the market is weak, and ETFs with high Outlook scores generally perform well over time in various market conditions.
Of course, each ETF has a unique set of constituent stocks, so the sectors represented will score differently depending upon which set of ETFs is used. For Sector Detector, I use ten iShares ETFs representing the major U.S. business sectors.
About Trading Strategies: There are various ways to trade these rankings. First, you might run a sector rotation strategy in which you buy long the top 2-4 ETFs from SectorCast-ETF, rebalancing either on a fixed schedule (e.g., monthly or quarterly) or when the rankings change significantly. Another alternative is to enhance a position in the SPDR Trust exchange-traded fund (SPY) depending upon your market bias. If you are bullish on the broad market, you can go long the SPY and enhance it with additional long positions in the top-ranked sector ETFs. Conversely, if you are bearish and short (or buy puts on) the SPY, you could also consider shorting the two lowest-ranked sector ETFs to enhance your short bias.
However, if you prefer not to bet on market direction, you could try a market-neutral, long/short trade—that is, go long (or buy call options on) the top-ranked ETFs and short (or buy put options on) the lowest-ranked ETFs. And here’s a more aggressive strategy to consider: You might trade some of the highest and lowest ranked stocks from within those top and bottom-ranked ETFs.
- Phil
Philip R. Davis is a founder of Phil's Stock World (www.philstockworld.com), a stock and options trading site that teaches the art of options trading to newcomers and devises advanced strategies for expert traders. Mr. Davis is a serial entrepreneur, having founded software company Accu-Title, a real estate title insurance software solution, and is also the President of the Delphi Consulting Corp., an M&A consulting firm that helps large and small companies obtain funding and close deals. He was also the founder of Accu-Search, a property data corporation that was sold to DataTrace in 2004 and Personality Plus, a precursor to eHarmony.com. Phil was a former editor of a UMass/Amherst humor magazine and it shows in his writing -- which is filled with colorful commentary along with very specific ideas on stock option purchases (Phil rarely holds actual stocks). Visit: Phil's Stock World (www.philstockworld.com)
© 2012 Copyright PhilStockWorld - All Rights Reserved Disclaimer: The above is a matter of opinion provided for general information purposes only and is not intended as investment advice. Information and analysis above are derived from sources and utilising methods believed to be reliable, but we cannot accept responsibility for any losses you may incur as a result of this analysis. Individuals should consult with their personal financial advisors.
PhilStockWorld Archive |
© 2005-2022 http://www.MarketOracle.co.uk - The Market Oracle is a FREE Daily Financial Markets Analysis & Forecasting online publication.