


U.S. Unemployment, What if the BLS Labor Force Participation Rate Projections Are Wrong?
Economics / Unemployment Dec 13, 2012 - 04:03 AM GMTBy: Mike_Shedlock

 On Monday, my "question of the day" was What will the unemployment rate look like for the rest of the decade?
Click on the above link to see an interactive map that lets you select the rate of job growth up to January of 2020.
The base assumptions for the interactive map regarding the noninstitutional population, the labor force, and the participation rate came from revised BLS projections by Mitra Toossi in January 2012: Labor force projections to 2020: a more slowly growing workforce
Note that the accuracy of the unemployment forecast depends on the accuracy of the assumptions.
What if the BLS is Wrong?
Today we concern ourselves with the question "What if the BLS assumptions are wrong?"
We do have to start somewhere, and the assumption for the charts below is that the BLS is right about the size of the age 16 and older noninstitutional population, but wrong regarding the participation rate and the size of the labor force.
Certainly boomer dynamics are now understood well enough that the age 16 and older noninstitutional population projections are likely to be quite accurate. How fast baby boomers retire or drop out of the labor force is certainly much harder to predict.
Definitions and Notes
- The participation rate is the ratio of the civilian labor force to the total noninstitutionalized civilian population 16 years of age and over.
- The noninstitutionalized civilian population consists of civilians not in prison, mental facilities, wards of the state, etc.
- The labor force consists of those who have a job or are seeking a job, are at least 16 years old, are not serving in the military and are not institutionalized.
- There are strict requirements on what constitutes "seeking a job". Reading want-ads or jobs on "Monster" does not count. One actually needs to apply for a job, go on an interview, or send in a resume.
- Please see Reader Question Regarding "Dropping Out of the Workforce" for an explanation of how the BLS determines someone is actively seeking a job.
Starting with the assumption that Toossi is correct regarding the noninstitutionalized civilian population, I asked Doug Short at Advisor Perspectives if he would plot unemployment rates at various rates of job growth with a participation rate of 62.5 (the base Toossi model), as well as participation rates of 60.0 and 65.0.
The charts below show startling differences as to what happens if the participation rate changes in those small increments.
Model Notes
- In the following charts CLF stands for Civilian Labor Force.
- CNP stands for Civilian Noninstitutional Population.
- Participation rates assumed to move in a linear fashion towards various 2020 projected targets (65.0, 62.5, 60.0).
- The labor force is derived from various projected participation rates and the civilian noninstitutional population.
Unemployment Assuming Participation Rate of 62.5
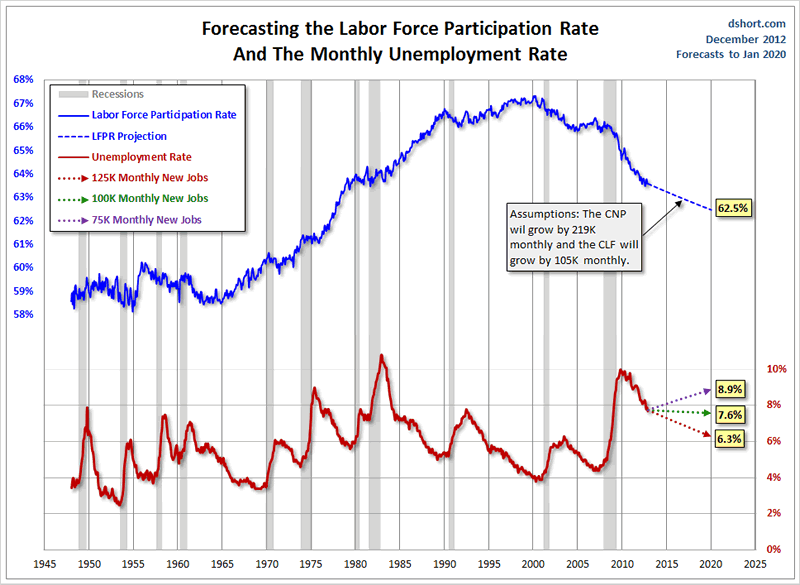 z
z
At 125,000 jobs a month (and that is a very optimistic forecast in my opinion), the unemployment rate would slowly sink to 6.3% by 2020.
Unemployment Assuming Participation Rate of 65.0
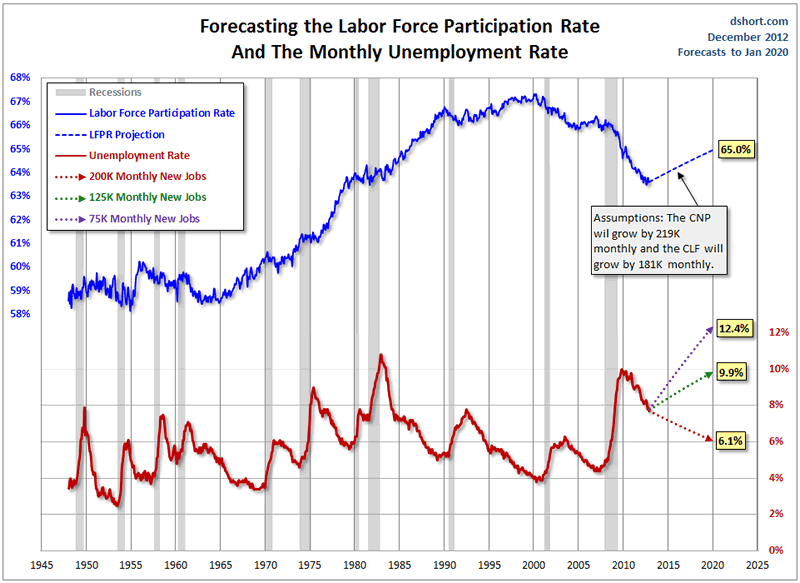
The current participation rate is 63.6.
A mere rise in the participation rate to 65 would require 200,000 jobs every month non-stop until 2020 to get the unemployment rate to 6.1%. Needless to say, 200,000 jobs a month is not going to happen.
At 125,000 jobs a month, every month, the unemployment rate would rise to 9.9%. Is such a scenario all that unlikely?
Unemployment Assuming Participation Rate of 60.0
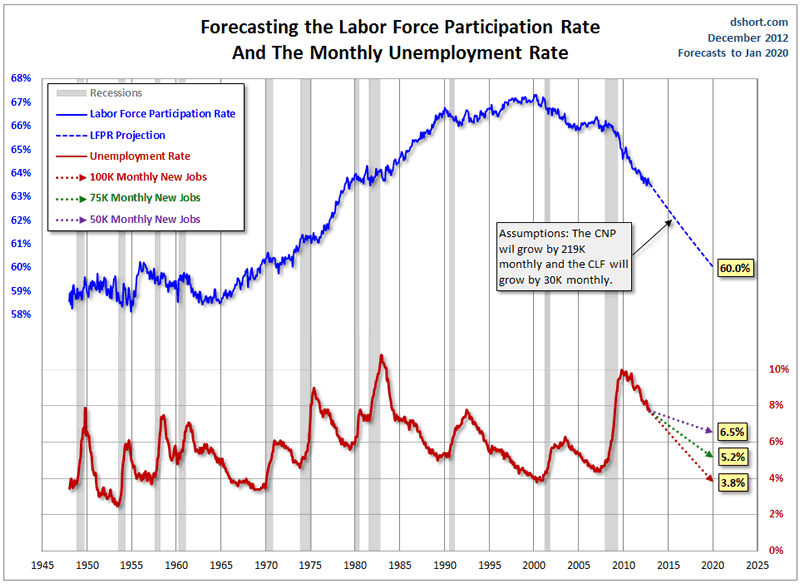
Should the participation rate drop to 60, it would only take 50,000 jobs a month to get the unemployment rate down to 6.5%.
How likely is that?
The participation rate was 60.2 in December of 1955. The participation rate dramatically rose starting in the mid-60's as women entered the work force en masse.
Given that people are living and working longer (the latter because they did not sufficiently save for retirement), will the participation rate drop to 60 again?
Consider what I said on May 1, 2008 in Demographics Of Jobless Claims
Ironically, older part-time workers remaining in or reentering the labor force will be cheaper to hire in many cases than younger workers. The reason is Boomers 65 and older will be covered by Medicare (as long as it lasts) and will not require as many benefits as will younger workers, especially those with families. In effect, Boomers will be competing with their children and grandchildren for jobs that in many cases do not pay living wages.
Theoretically the participation rate could drop that low but the economy will likely be horrific if it does. Moreover, should the rate fall that low, it will be at the expense of a massive rise in those on food stamps and other social safety net programs.
Table of Projected Unemployment Rates
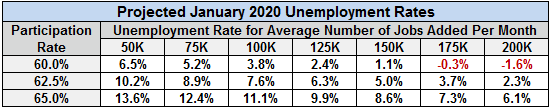
Note the peculiarity (and mathematical impossibility) of negative unemployment rates at high levels of job creation coupled with a participation rate of 60.
All things considered, Toossi's revised model showing the participation rate slowly dropping to 62.5 seems reasonable, but a rise to 65 is not out of the question.
At a participation rate of 62.5 it will take about 100,000 jobs a month through 2020 just to hold the unemployment rate steady.
For a look ahead to 2013, please see Small Business Owners' Hiring Intent Plunges to 2008 Lows; Don't Blame Sandy or Fiscal Cliff.
By Mike "Mish" Shedlock
http://globaleconomicanalysis.blogspot.com
Click Here To Scroll Thru My Recent Post List
Mike Shedlock / Mish is a registered investment advisor representative for SitkaPacific Capital Management . Sitka Pacific is an asset management firm whose goal is strong performance and low volatility, regardless of market direction.
Visit Sitka Pacific's Account Management Page to learn more about wealth management and capital preservation strategies of Sitka Pacific.
I do weekly podcasts every Thursday on HoweStreet and a brief 7 minute segment on Saturday on CKNW AM 980 in Vancouver.
When not writing about stocks or the economy I spends a great deal of time on photography and in the garden. I have over 80 magazine and book cover credits. Some of my Wisconsin and gardening images can be seen at MichaelShedlock.com .
© 2012 Mike Shedlock, All Rights Reserved.
Disclaimer: The above is a matter of opinion provided for general information purposes only and is not intended as investment advice. Information and analysis above are derived from sources and utilising methods believed to be reliable, but we cannot accept responsibility for any losses you may incur as a result of this analysis. Individuals should consult with their personal financial advisors.
Mike Shedlock Archive |
© 2005-2022 http://www.MarketOracle.co.uk - The Market Oracle is a FREE Daily Financial Markets Analysis & Forecasting online publication.