


Did the SP500 Stock Market Index Finally Bottom?
Stock-Markets / Stock Markets 2012 Nov 08, 2012 - 01:42 PM GMTBy: David_Banister

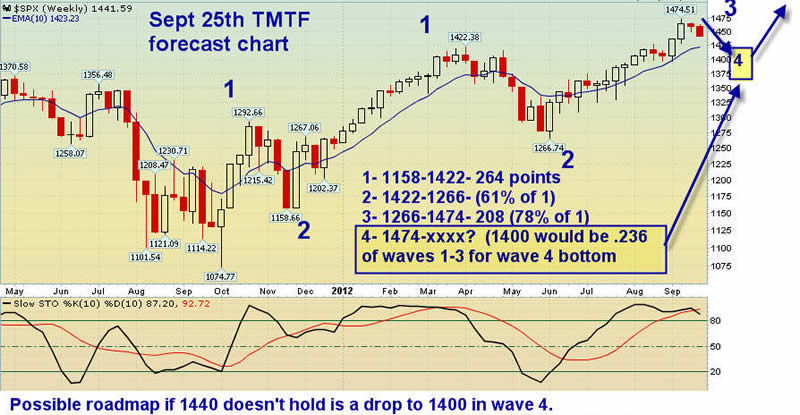
The SP 500 finally caved to match or go a bit lower than the SP 500 futures lows of about 11 days ago in yesterday’s action. The drop to the 1390 area is within our 1386-1400 pivot points for a major wave low pattern that we outlined as far back as September 25th for our subscribers.
Our work centers around sentiment and crowd behavior, the headlines are of interest but only tell you the psychology of the publishing arms or talking heads at the time. Often headlines can be negative and the market climbs, or positive and the market is dropping. So the key for our work is figuring out where we are in the sentiment patterns of the crowd, and then to anticipate the pivots ahead of time and invest accordingly.
In fact, in just 24 hours or so we had a 43 point SP 500 drop… this is interesting because the same thing happened at the June 2012 lows as well. Back then we had outlined pivots in the 1250-1270 areas as likely lows, and the market ended up bottoming at 1267. This bottom area yesterday fits within pivots we were able to anticipate 7 weeks ago, without any knowledge of the election or other headlines around the world.
Often, major washout days like yesterday centering around major news (Election) can create the final panic sell-off to complete a wave pattern of negative sentiment to the downside and then reverse the markets higher in new bullish pattern. To be sure, there are many sentiment headwinds like the Fiscal Cliff and more in the coming weeks…but markets tend to price all that in ahead of time right?
At yesterdays lows the market seems to have completed all requirements for a C wave of an ABC complicated decline from the 1474 SP 500 highs and so far an 8 Fibonacci week correction period.
What we expect is a rally now and again, we need to get back up and over 1423-1427 pivots this time and hold more than 24 hours, but the odds of a rally are now at 75% from here. IF we fail to hold the 1388 pivots, then the next levels are 1372 and 1363 to watch.
Bottom Line? Most metrics have been met for a wave pattern low, (Whether this be wave 4 or wave 2 doesnt much matter just yet) and the market now has a chance to start a wave 5 or wave 3 rally to the upside. Lets watch 1388 areas to hold first, then we will watch 1403, then 1423-1427 pivots to clear. We are neutral to bullish now after this washout
Back on Sept 25th we did a chart forecasting a drop to 1395-1400 as likely before the downtrend would end, now let’s see if the market can get some legs here. We have included that old chart here to show you how crowds are fairly predictable in their behavioral patterns in advance.
Consider joining us for 90 days trial period and play along. We provide all the alerts in real time via Email and internet posting. We provide daily updates on all positions and 24/7 Email access to me for any questions.Learn more and sign up at http://www.markettrendforecast.com/
Dave Banister
CIO-Founder
Active Trading Partners, LLC
www.ActiveTradingPartners.com
TheMarketTrendForecast.com
Dave Banister is the Chief Investment Strategist and commentator for ActiveTradingPartners.com. David has written numerous market forecast articles on various sites (MarketOracle.co.uk, 321Gold.com, Gold-Eagle.com, TheStreet.Com etc. ) that have proven to be extremely accurate at major junctures.
© 2010 Copyright Dave Banister- All Rights Reserved
Disclaimer: The above is a matter of opinion provided for general information purposes only and is not intended as investment advice. Information and analysis above are derived from sources and utilising methods believed to be reliable, but we cannot accept responsibility for any losses you may incur as a result of this analysis. Individuals should consult with their personal financial advisors.
© 2005-2022 http://www.MarketOracle.co.uk - The Market Oracle is a FREE Daily Financial Markets Analysis & Forecasting online publication.