


Key to Interpreting the Stock Market - Technical Or Fundamental Analysis?
Stock-Markets / Stock Market Valuations Feb 18, 2008 - 07:36 AM GMTBy: Clif_Droke

 One of the best practitioners of technical analysis of the last 30-40 years, and one of my personal favorites, was Ralph Bloch. Bloch was for many years the chief market technician with Raymond James and was renown for his down-to-earth manner and “say it like it is” approach to the stock market.
Bloch was known for using only the most basic of all analytical tools when it came to T.A. and he relied mainly on the charts and the tape for his trading decisions. When it came to his technical approach to the market, he once described himself as “a ham-and-egger…I'm a Technical Analysis 101 guy all the way.”
He was once asked by an interviewer why he didn't use the more sophisticated tools like the stochastics indicator. He responded, “Number one, I've no idea what it is and number two, I'm not even sure I can spell it.” He always maintained that today's traders tend to get caught up with the large variety of tools at their disposal and they end up neglecting the most important and basic ones. His track record was top-notch and was a testimony to the soundness of his approach.
One of the things Bloch always maintained was that technical analysis, to be extremely useful, should be used mostly for short term trading. Beyond the short term, he said, technical analysis loses its accuracy and is less useful for the longer term time frames. That's not to say that looking at long-term charts is a wasted exercise, only that a strictly technical approach to predicting the long term outlook for stocks isn't advisable. To get the long-term outlook, one must look beyond the purely technical approach. That's where fundamental analysis comes in.
I've always found it ironic that the two most basic types of trading and investment styles, namely technical and fundamental, are usually at odds with each other. Ask any die-hard technician what he thinks of the fundamental approach and he'll usually respond, “The charts tell me all I need to know. They record the fundamental outlook, so why bother looking at fundamentals?” A fundamental disciple will usually retort, “Charts and indicators are just squiggly lines and have no prognosticative value whatsoever. You've got to parse the numbers to get to the bottom line in the stock market.”
Actually, both sides have their good points and their limitations. In my experience, any attempt at predicting or trading the markets from a short term outlook using only fundamental analysis is akin to financial Russian Roulette. Fundamental analysis just isn't geared toward predicting short term outcomes, especially since there are so many invariables involved. On the other hand, any attempt at making long-term predictions using strictly a technical approach is equally foolish and has no consistent accuracy.
The longer term outlook is what fundamental analysis is made for. The short-term is for technical analysis. The two disciplines should learn to work with each other instead of constantly bickering about which approach is superior. Both have their own unique merits but neither will work consistently as a standalone approach across all time frames.
It's with some frustration, then, that I listen to analysts who keep trying to predict the longer term stock market outlook using technical analysis alone. Over the past few weeks I've heard dozens of experts weigh in on the financial outlook for the 6-18 months ahead and make all kinds of comparisons to the previous bear market versus where we're at now. I've seen them pontificate on scores of long-term charts of the Dow and S&P with all kinds of trend lines and channels, moving averages, indicators, etc. These technical tools are being used by many traders and analysts to predict a repeat of the 2000-2002 bear market since, according to them, there is so much similarity between what these technical tools look like now vis-à-vis 2000-2002.
At face value, they may very well have a point. But we've already established that technical analysis isn't designed for making predictions about the longer term. That's why I consider it a fallacy to look at the weekly and/or monthly charts of the S&P 500 index, compare moving averages and trend lines, chart positions, etc., and expect to come up with a reliable outcome. Technical analysis simply can't tell you what direction to expect of the broad market beyond a certain (and relatively brief) window of time.
So putting the technicals aside, how can we know where we stand in relation to the previous long-term top in 2000? The answer is found in fundamental analysis. By fundamental I mean the basic supply/demand balance for stocks. This takes into account things like float, earnings and yields, comparative valuation and a few other basic factors. Specifically, we'll start with the most basic of all fundamental approaches: money supply analysis.
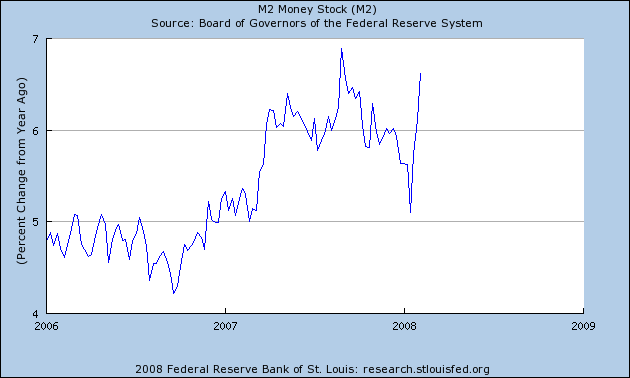
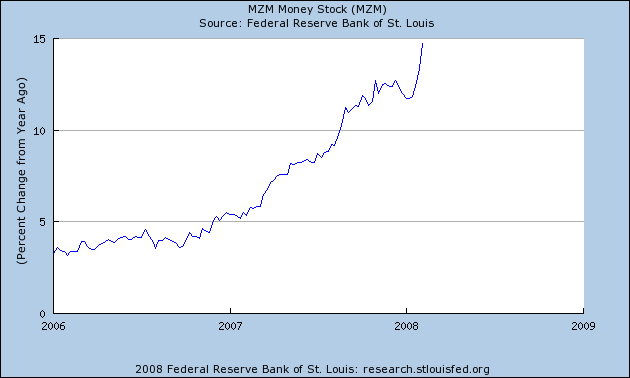
We've long noted that the MZM and M2 money supply has been in an upward trend in the past couple of years. This is good news for the economy in the longer term as the last bear market and recession was preceded by a contraction in money supply. This is one reason why I don't believe the present situation can be compared to 2000-2002. Just look at the huge spike in M2 and MZM money in just the last two weeks alone. It's obvious that the monetary regulators are dead set on reversing economic conditions and forestalling recession.
Valuation remains bullish, which means the longer-term trend for stocks is bullish as reflected in the IBES Valuation Model. According to IBES, stocks are nearly 50% undervalued compared to the 10-year Treasury yield. This is the most undervalued that stocks have been in the last 35 years. Heading into the 2000-2002 bear market, stocks were dramatically overvalued according to IBES. The situation has been reversed today and this is a big reason why another repeat of 2000-2002 isn't expected.
Valuation is the key here, for it provides the backdrop for the bull market to continue in the longer term. This is a critical component that wasn't present heading into the previous bear market. Share counts are also drastically reduced compared to eight years ago as the supply of shares in the late ‘90s was dramatically increased, especially in the tech sector. With mergers and acquisition and takeovers (not to mention Sarbanes Oxley) reducing the supply of shares, stocks have less overhead pressure in times of weakness.
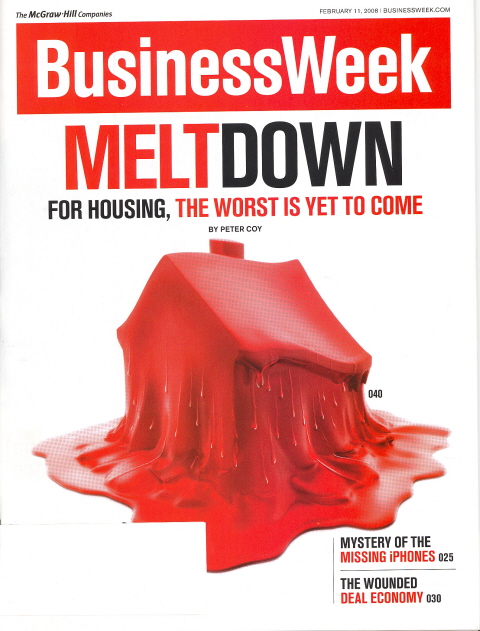
A final consideration is sentiment. The past month has seen more bearish news magazine and newspaper front covers than I can ever remember seeing. A couple of weeks ago the infamous “Road to Recession” cover appeared in Newsweek . Another bearish cover was seen on a recent issue of Business Week . The headline says, “Meltdown: For Housing, the Worst is Yet to Come.”
Here are more recent headlines from the Financial Times which further underscore the hyper-fear in the financial markets. Such a high level of fear is consonant with an intermediate-term bottoming procedure in the stock market:
“Corporate America braced for recession”
“The start of the great unwinding”
“Beware of a market rally…it could be a false dawn.”
With the worst of the financial crisis already reflected in the front covers of the major news magazines, you can bet the stock market has already discounted the future. Keeping in mind that the stock market looks ahead by 6-9 months, the revelations of the past year have already long since been digested by the market. As pointed out in the previous newsletter, the Dow is only down 100 points or so from a year ago when the sub prime fiasco first became news. If the doom-and-gloomers are correct about the bearish long-term implications of the bad news, wouldn't the Dow be down 1,000-2,000 points or more by now? Something to think about.
By Clif Droke
www.clifdroke.com
Clif Droke is editor of the daily Durban Deep/XAU Report which covers South African, U.S. and Canadian gold and silver mining equities and forecasts PM trends, short- and intermediate-term, using unique proprietary analytical methods and internal momentum analysis. He is also the author of numerous books, including "Stock Trading with Moving Averages." For more information visit www.clifdroke.com
Clif Droke Archive |
© 2005-2022 http://www.MarketOracle.co.uk - The Market Oracle is a FREE Daily Financial Markets Analysis & Forecasting online publication.