


Forecasts for Gold, HUI Index And The US Dollar
Commodities / Gold and Silver 2012 Oct 25, 2012 - 02:49 AM GMTBy: Vin_Maru

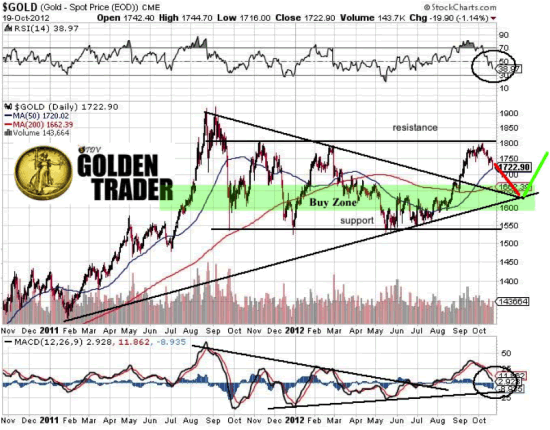
 Looking at the gold chart below, we can see that gold has been correcting over the last two weeks. When applying some technical analysis to the gold chart, we can clearly see that there would have been overhead resistance at $1800 since most of the year gold has traded between $1550 and $1800. A few weeks ago, we also noticed a big build in the short position on the Comex's Commitment of Traders report COT by the commercial and bullion banks. The effort to stop gold's advance at a key resistance level was successful in part because of the huge increase in the short position at that level, which is why we knew to take some profits and that would be an ideal place for a correction to start.
Now that the correction has started and gold is giving back some of its gains from the summer, the question now remains: How much of a retracement will we see on the price of gold? While the shorts are currently in control of driving the price down, support will come from other central banks and buyers of physical gold.
With gold at $1701, it is currently (noon on Tuesday Oct. 24) sitting below the 50 dma at $1720 which is above the 200 dma at $1662. The first line of support for this coming week was at $1720 and if it holds above the 50 dma the correction in gold could be over. If we continue to see weakness in gold over the next week or two, we can expect the correction will continue later this month and going into elections. This is something I suspect could happen if the overall markets continue to remain week.
Looking at the chart we suspect that buying will come in at the new support price range at about $1650 (+ or - $20) if the 50 dma at $1720 doesn't hold this coming week. One thing to note is that the 50 dma crossed above the 200 dma around the end of September, which is an over good sign. However it needs to remain above the 200 dma for this advance higher in gold to hold before it can go on to make new highs. We remain optimistic that gold will either bounce here at the 50 dma of $1720 or at a retest of the 200 dma of $1662, which would still be bullish over all. If you are looking to add to your physical gold holdings and diversifying them internationally, scaling in now and at the $1650 price range would be a good place to start adding to current or new positions. Keep in mind that the support at the 200 dma may not hold, which means the price of gold can retrace right back to longer term support at $1550 which has been in place all year. However, I give it a small probability that we will correct back to that price range as we are entering a seasonally strong part of the gold cycle in November and December.
While I hate making predictions on what the gold price will do short term, I suspect it could consolidate between $1650 - $1750 for the remainder of the year. While we are entering a stronger part of the gold season and the fundamentals are lined up to suggest higher prices, we have conflicting events such as a huge concentrated short position, the US elections, the US fiscal cliff and tax loss selling to deal with for the remainder of the year. With 2 strong opposing forces acting on one another, the price of the metal may consolidate around $1650 - $1750 for some time until either the bulls or bears clearly take this market in one direction or another. Until then, all we can do is sit around and wait for a clear break outside the trading range that has been established over the last year.
HUI Gold Miners Index Analysis
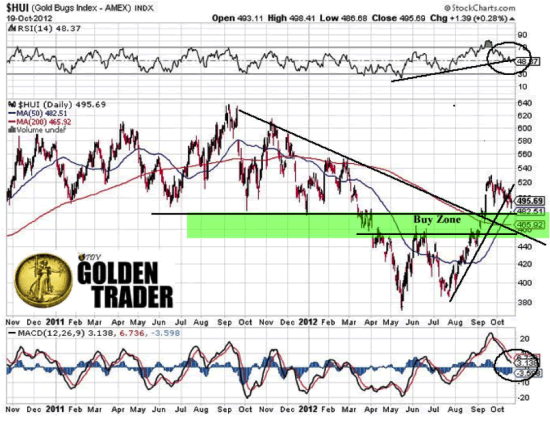
Just like gold, the HUI index is also correcting since September. Earlier last month, we thought index would trade to 520 before meeting resistance, which we can clearly see it has done and it is now in the process of correcting. It would not be unusual for the index to give back up to 50% of its recent gains from the summer lows. Back in July, it looks like a low of 385 was made on the index and a recent high of 525 was achieved back in September; this is a 140 point gain. So if the market was to give back 50% of this gain or 70 points, we can expect the HUI to retrace back to about 455, which would be the next best time to add to positions.
Currently the HUI is at 495 which is still above the 50 dma at 482 and the 200 dma at 465, which is a positive alignment if the index can hold these gains. One thing to pay attention to from the chart below is the price action on the HUI from April this past year to the end of August, a period called the summer doldrums. During this period support came around 385 and was tested 2 different times, while overhead resistance was at 450 which also was tested a couple of times. Back then 450 was overhead resistance which was finally broken with a strong move higher during September; we suspect this will now become the new support level while 520 will act as resistance.
While we still remain cautiously optimistic that a new uptrend has started longer term, the HUI will most likely correct back to the 460 range ( + or - 10 points) over the coming months and 520 will now act as overhead resistance as a new trading range will be set. In general, support around 465 (the 200 dma) is where we would look to initiate new positions in some of the senior producers and hold them going into the New Year. At some point, I do expect overhead resistance at 520 will be breached to the upside at which point the HUI index could run to 580 and higher, but that would mean gold would have to be on fire and trading above its overhead resistance at $1800 on a holding basis. Until then, the miners will probably trade in a range where the HUI fluctuates between 460 and 520 as long as gold stays above $1650.
US Dollar Analysis
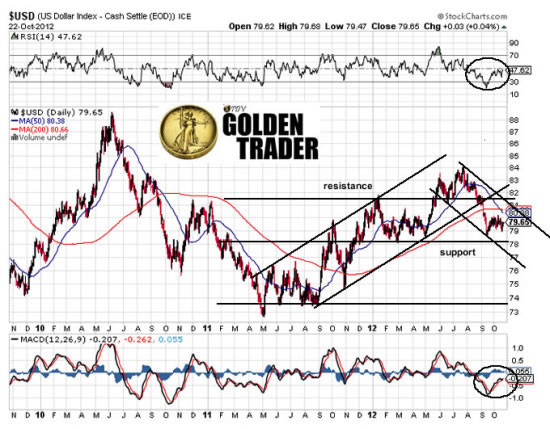
While the US dollar is looking good at the moment and getting a nice little bounce higher lately, this could be very short lived. The up channel that has been in place from August 2011 to August 2012 has been clearly broken and now it has started a new down trend channel this past August.
All we are seeing is a current bounce from oversold levels on the RSI and MACD and it already seem to be stalling out. The US dollar could move slightly higher to test the 50dma of 80.38 or the top of the new down channel at 81, but the rally should stop there. One thing to note is that the 50 dma just crossed below the 200 dma in the last few days, that is not a good sign. Once this relief rally is over, the dollar should continue downward and possibly to the bottom end of this downward channel. This could mean a definitive move below recent support around 78 on the index, if this happens and support is broken, it could lead to a cascading move downwards towards 75 or possibly 73.75 as the next major support level. If the dollar does break down, gold and silver will shoot much higher.
The best hope for the US dollar is for it to sit in a channel between 78 and 81.50 which is where I think it could trade sideways for some time until we clear the elections and get some direction on fiscal policy from the Fed. If the dollar goes sideways, G and S will also trade in a sideways channel. More than likely we will get some clear direction once the election are done.
If you enjoyed reading this article and are interested in protecting your wealth with precious metals, you can receive our free blog by visiting TDV Golden Trader. Also learn how you can purchase and protect your gold holdings by getting a copy of our special report Getting Your Gold out of Dodge or protecting the stock investments you currently own with Bullet Proof Shares.
© 2012 Copyright Vin Maru- All Rights Reserved
Disclaimer: The above is a matter of opinion provided for general information purposes only and is not intended as investment advice. Information and analysis above are derived from sources and utilising methods believed to be reliable, but we cannot accept responsibility for any losses you may incur as a result of this analysis. Individuals should consult with their personal financial advisors.
© 2005-2022 http://www.MarketOracle.co.uk - The Market Oracle is a FREE Daily Financial Markets Analysis & Forecasting online publication.