


Manipulating the U.S. Unemployment Rate, About That "Expected" Drop In Participation Rate
Politics / Unemployment Oct 08, 2012 - 02:42 AM GMTBy: Mike_Shedlock


Calculated Risk had an interesting but misleading post A decline in the participation rate was expected due to the aging population.
This decline in the participation rate has been expected for years. Here are three projections (two from before the recession started). The key to these projections is that the decline in the participation rates was expected:
1) From BLS economist Mitra Toossi in November 2006: A new look at long-term labor force projections to 2050
2) From Austin State University Professor Robert Szafran in September 2002: Age-adjusted labor force participation rates, 1960–2045
3) BLS economist Mitra Toossi released some new projections for the participation rate as of January 2012: Labor force projections to 2020: a more slowly growing workforce.
Misleading Chart
Yes, a decline in the participation rate was expected. My problem with his analysis regards the miss-portrayal of the rate at which the participation rate was scheduled to happen.
Calculated Risk posted this chart.
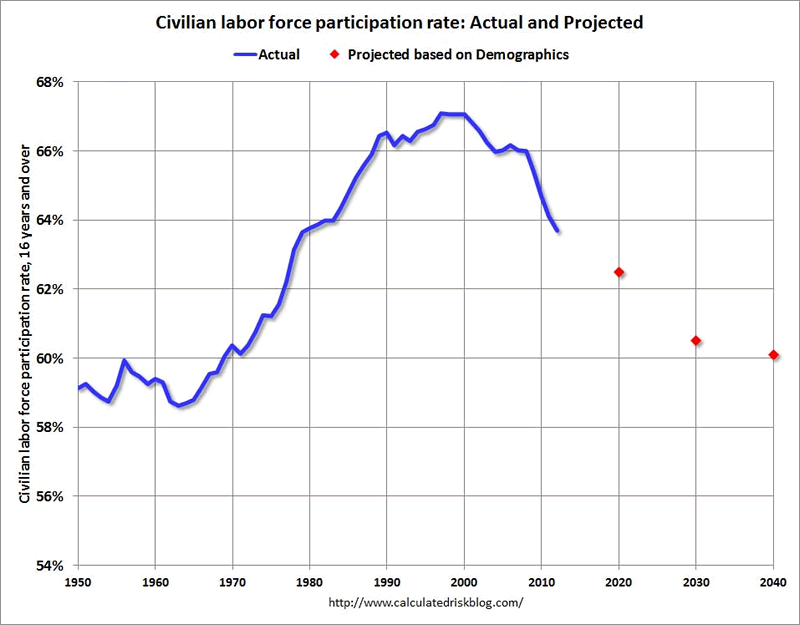
The above chart was created in 2012 and does not remotely match demographic projections made earlier.
For example, Robert Szafran estimated in September of 2002 the participation rate pattern would look like this.
| Year | Participation Rate |
|---|---|
| 2005 | 66.8 |
| 2010 | 65.9 |
| 2015 | 64.6 |
| 2020 | 63.0 |
In September 2005 the participation rate was 66.1. In September of 2010, the participation rate was 64.6 which Szafran did not expect until 2015. The current participation rate is 63.6, a number Szafran expected in 2019 perhaps.
BLS analysis was much worse even though the BLS had more years of data to consider.
BLS Analysis
Let's take a look at BLS projections made in 2006.
| Year | Participation Rate |
|---|---|
| 2010 | 65.9 |
| 2020 | 64.5 |
| 2030 | 61.7 |
Let's look at BLS labor force projections, also from 2006. Numbers in thousands.
| Year | Labor Force | Projected Increase |
|---|---|---|
| 2005 | 149,320 | |
| 2010 | 156,511 | 7,191 |
| 2020 | 166,355 | 9,844 |
| 2030 | 172,910 | 6,555 |
Taking demographics into consideration, the BLS projected the labor force to grow by 7.19 million to 156.51 million in 2010. The actual labor force in September of 2010 was 153.92 million, a nice fat miss of 2.59 million.
Indeed, two years later, the labor force is still only 155.06 million.
So, the decline in participation rate was certainly not expected as Calculated Rick states in bold. It only appears that way, based on after-the-fact BLS analysis starting with chart that shows new baseline projections made in January of 2012.
By the way, if the current participation rate was 64.6 (the number Szafran expected in 2015, and essentially the the number the BLS originally estimated for 2020), the labor force would be roughly 157.44 million, not 155.06 million. The unemployment rate would be 9.2%.
In January 2008 the participation rate was 66.2. It is now 63.6 (a number way lower than Szafran expected for 2015).
Conclusion: While the Participation Rate trend is certainly down, and down was expected, most of the decline in participation rate since the start of the recession is due to economic weakness, not demographics.
For further discussion please see ...
- Lost Bet
- "Unbelievable Numbers" Says Former GE CEO Jack Welch; Another Look at Jobs Including Government Jobs and Self-Employment
- September Jobs +114,000; Unemployment Rate 7.8%; Part-Time Workers +582,000; Initial Reaction and Election Impact
By Mike "Mish" Shedlock
http://globaleconomicanalysis.blogspot.com Click Here To Scroll Thru My Recent Post List
Mike Shedlock / Mish is a registered investment advisor representative for SitkaPacific Capital Management . Sitka Pacific is an asset management firm whose goal is strong performance and low volatility, regardless of market direction.
Visit Sitka Pacific's Account Management Page to learn more about wealth management and capital preservation strategies of Sitka Pacific.
I do weekly podcasts every Thursday on HoweStreet and a brief 7 minute segment on Saturday on CKNW AM 980 in Vancouver.
When not writing about stocks or the economy I spends a great deal of time on photography and in the garden. I have over 80 magazine and book cover credits. Some of my Wisconsin and gardening images can be seen at MichaelShedlock.com .
© 2012 Mike Shedlock, All Rights Reserved.
Disclaimer: The above is a matter of opinion provided for general information purposes only and is not intended as investment advice. Information and analysis above are derived from sources and utilising methods believed to be reliable, but we cannot accept responsibility for any losses you may incur as a result of this analysis. Individuals should consult with their personal financial advisors.
© 2005-2022 http://www.MarketOracle.co.uk - The Market Oracle is a FREE Daily Financial Markets Analysis & Forecasting online publication.