


Secular Commodity Markets Peak Forecast 2013
Commodities / Commodities Trading Sep 24, 2012 - 12:30 PM GMTBy: John_Hampson

 Forecasting a secular commodities bull market peak is two-part: why commodities should make a blow-off price acceleration and why commodities should then fall out of favour in an enduring way.
Let me start by showing that commodities have been a particularly poor-performing asset class over time:
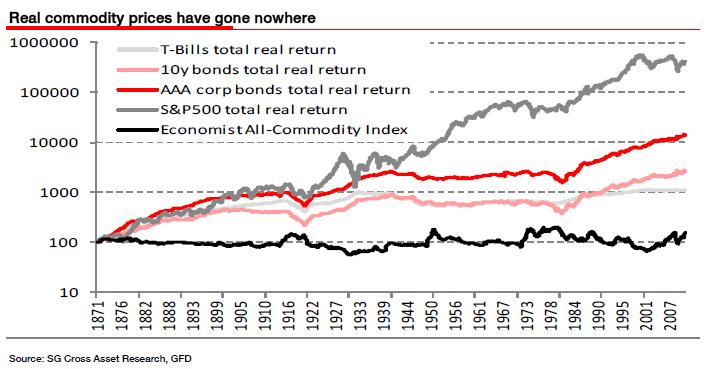
In real terms, commodities have gone nowhere in almost 150 years, whilst the best performing asset class has been equities. In short, the large difference between the two is the value-add of humans, real economic growth through technological evolution. On closer inspection, the chart reveals that commodities have enjoyed short periods of real price surges around 30 years apart, and the latest such secular commodities bull market has been underway since around 2000. We can see this clearer in the chart below.
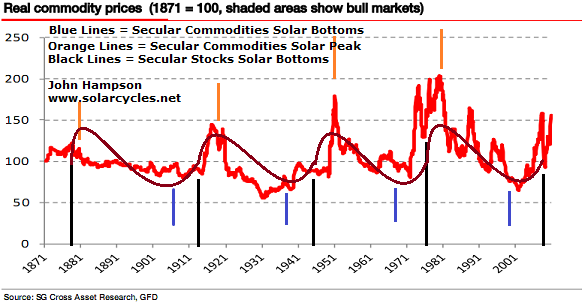
Commodities follow a sine wave over time, and the next peak is projected to be 2013.
Here is the equally weighted CCI commodities index chart, showing a secular bull trend still in tact.
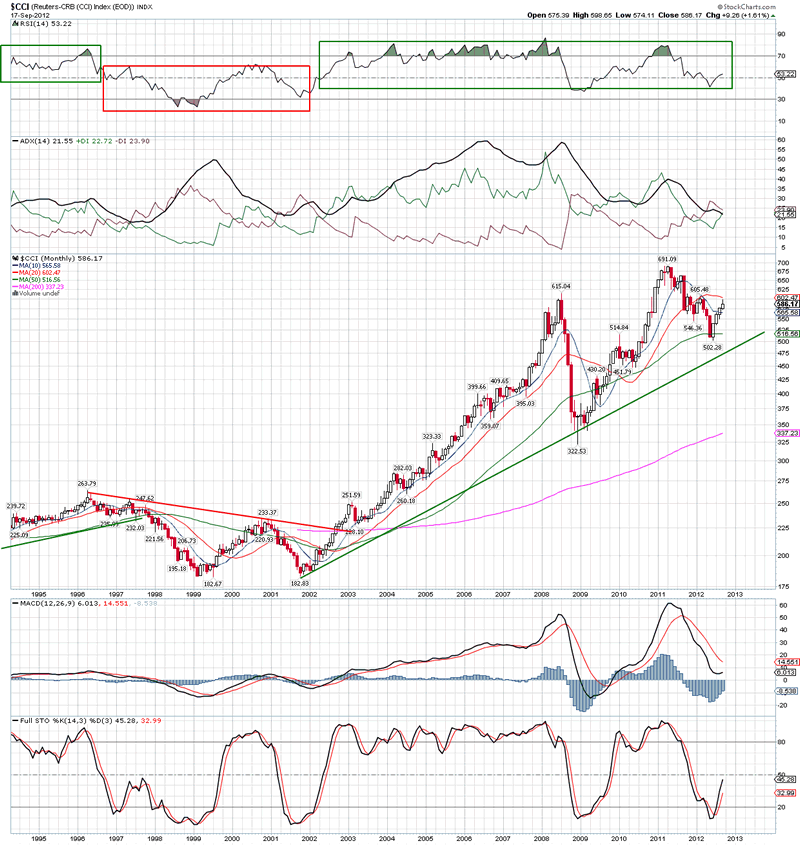
Source: Stockcharts / Niels Orskov
The previous secular commodities bull markets ran roughly 1906-1918, 1938-1948 and 1968-1980, all around 12 years in duration. Based on these historical precedents (current bull 12 years old), plus the longer term trend in real commodities, we have reasons to expect that the secular commodities bull market should be coming to an end imminently, UNLESS there has been a paradigm shift. That paradigm shift would be fossil fuel exhaustion and natural resources depletion, i.e. that humans have spent their natural resource heritage in order to fuel economic growth, and commodities are now being repriced permanently upwards as they start to run out. Indeed, historic projections put peak oil around now. However, the picture for future energy supply has improved due to large gas finds and expansion of renewables – see chart below.
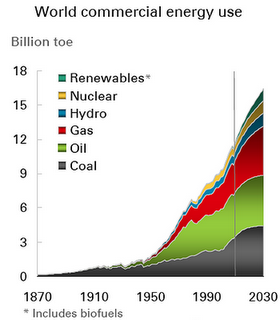
Source: BP
Considering gas, water, copper and others, the crunch point shouldn’t occur until beyond 2030, based on current trends.
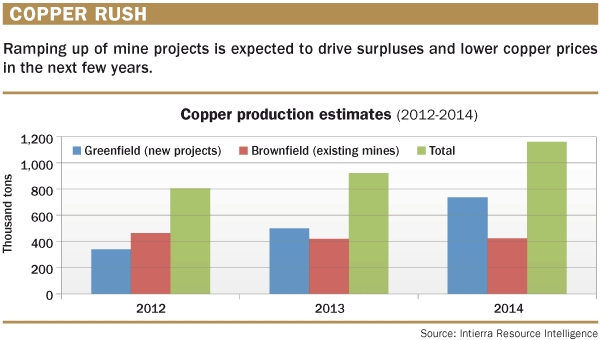
In addition, new mines and new energy fields are coming on stream, typically taking up to 10 years to reach production from initial plans, and adding to supply. Once commodity prices take off in a new secular bull, there is a lag in new supply coming in stream. Below we see copper production projections ramping up ahead, particularly in 2014.
Next we see OPEC crude oil production stretching back to the 1970s. Note how the oil secular bulls of then and now correspond to declining or flat production, whereas the oil secular bear was set against steadily rising production. Looking forward, some new supply is coming on stream from non-OPEC countries.
Here is gold mining in the long term view. Here you can see that secular bull markets in gold typically occurred in the face of declining production, until new supply caught up. Note that gold production has been on the rise again in the last 3-4 years of the current secular bull, suggestive of an imminent new secular bear.
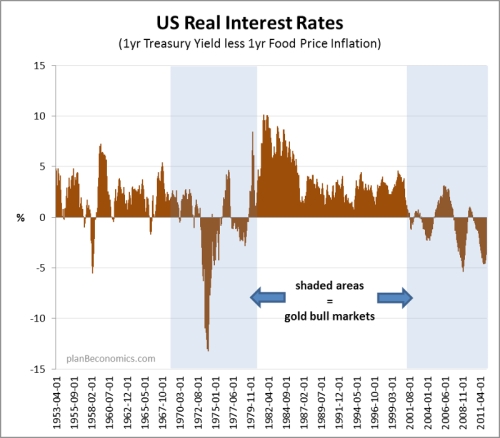
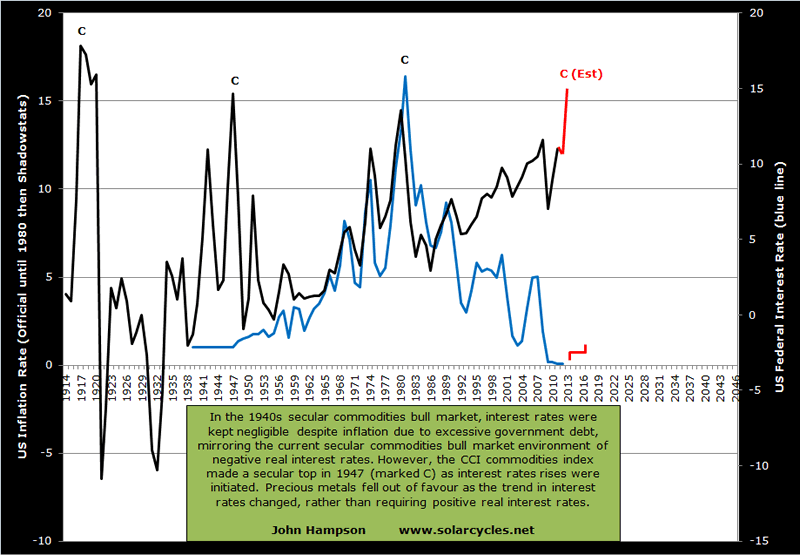
The precious metal’s appeal, despite increasing supply, is in part due to a persistent environment of negative real (inflation-adjusted) interest rates. Gold has no yield, so comes into favour when cash and bonds are paying negative real yields. The chart below shows how the last two secular gold bulls have been set in that kind of environment, and the 1940s bull was also.
The 1940s secular commodities bull perhaps shares the greatest similarities with our current one, in that interest rates were kept negligible despite inflation, due to excessive debt. The chart below shows US inflation versus interest rates, including both periods. Note that the secular commodities bull of the 1940s topped out in 1947 (measured by the CCI index) just as a trend reversal in interest rates began. In other words, although real interest rates at that time were still negative and remained so into the 1950s, it was enough for a programme of rate rises to BEGIN to end the secular commodities bull market, as the focus turned in favour of yielding assets.
As well as yield, relative value has also been a key factor in marking the beginnings and ends of secular asset bull and bear markets. First we see a long term view of UK house prices measured in gold, i.e. a real estate to gold ratio, and this chart reveals that we are into the zone of extreme expensiveness for gold versus UK housing.
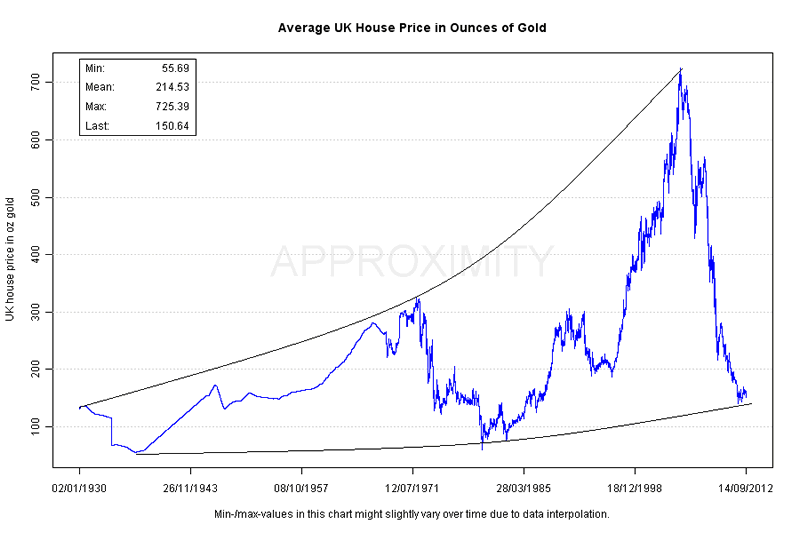
Source: Approximity
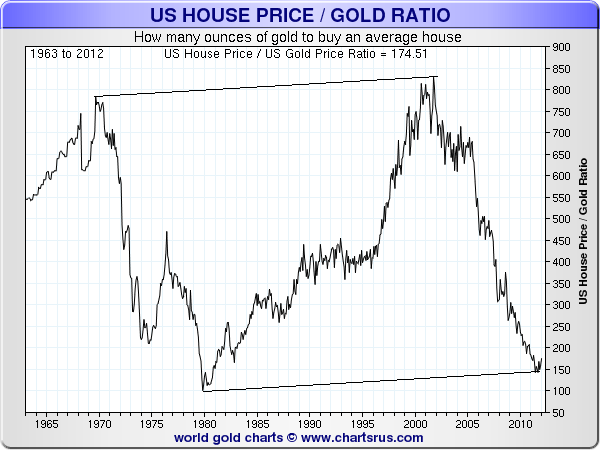
Secondly we see gold versus US real estate, and a similar picture of extreme cheapness in real estate compared to gold. These charts are suggestive of an imminent secular reversal between the two assets.
Thirdly, we see gold versus equities, as measured by the DJIA stock index. Here we can see that the ratio has fallen from 43 in 2000 to single digits today i.e. from stocks being expensive and gold cheap to the opposite. Based on the long term trend lines, this ratio could fall further to around 4 (or even lower, per 1980) before signalling an imminent reversal.
Source: IntelligentBear/Sharelynx
If we consider the Dow Jones stock index relative pricing to Brent crude oil, we see something similar, namely that oil is historically expensive versus equities, but that the ratio could well move further to the extreme before signalling a reversal.
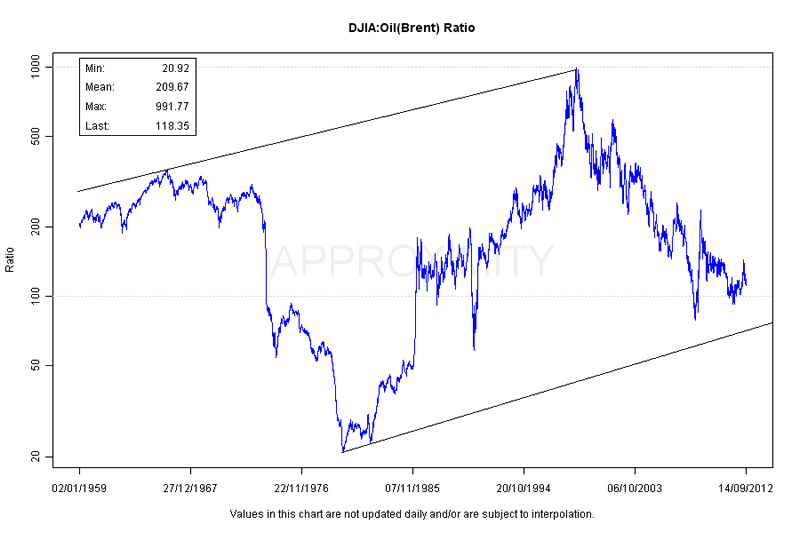
Source: Approximity
Several such ratios are united in the chart below, which provides a useful overall view of where we stand. I have marked the secular commodities bull market peaks with a C, and have added the black horizontal line, which I suggest is the level over which the ratio lines ought to reach before this secular commodities bull reverses.
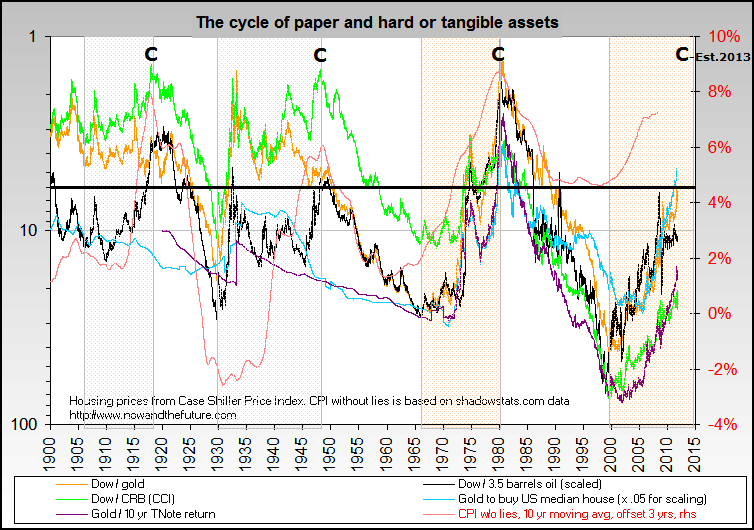
Source: Nowandfutures
But should could real estate and equities drop in price, rather than commodities rising in price, to achieve the ratio extremes?
Considering global real estate against rents and income, we can see that in several countries house prices have currently reached extremes of historic undervaluation, whilst in others not yet.
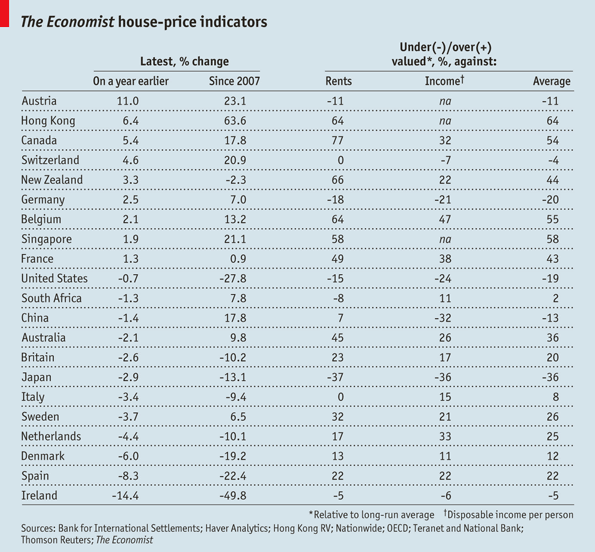
Source: The Economist
And likewise equities have reached extreme undervaluation – sub CAPE 10 – in certain countries, whilst in others not yet.
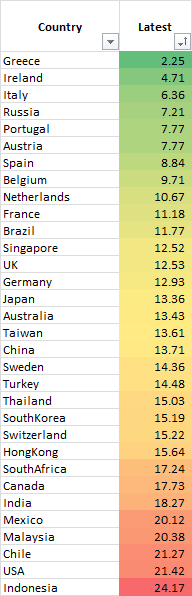
Source: Megane Faber
Meanwhile, the most widely held global government bonds are typically paying negative real returns, as is cash.
In summary, certain countries’ stock indices and real estate markets have reached secular extreme cheapness and should rise rather than fall in price, which puts some support under both asset classes globally, particularly as we see that real estate and equities are into the zone of historical relative major value to bonds and commodities. With bonds and cash paying negative returns, but money parked there through fear, there is the potential for large money flows into pro-risk assets if confidence grows. Real estate is the second best long term returner after equities.
If pro-risk rallies, then commodities outperform in relation to equities before reaching major secular expensiveness extremes, but any parabolic rise in commodities from here would likely be the last of their secular bull, as precious metals in particular would reach expensiveness extremes and investors would begin to abandon gold with its lack of yield or usefulness and long term poor real performance.
So, if we consider there is the potential for just one more major ascent for commodities, secular history suggests that this should indeed occur. Secular bull markets typically end with a blow-off finale, a mania. In previous secular commodities bull markets, commodity prices have accelerated roughly 6 months prior to the ultimate peak, and gone crazy with roughly 6 weeks to go. So, we can look for a combination of a parabolic unsustainable price rise together with extremes in overbought and overbullish indicators, lining up with true extremes in the relative asset value ratios above. They would be the clues to exit commodities.
Secular history reveals that prices should fall hard following the peak, and then gradually recover to make a smaller shadow bounce a couple of years later, before settling into a long term sideways secular bear market.
We can have a stab at timing the secular commodities peak, through solar cycles. Bearing in mind that solar maximums occur only roughly every 11 years, previous secular commodities peaks, and associated inflation peaks, have fallen close to the solar maximums.
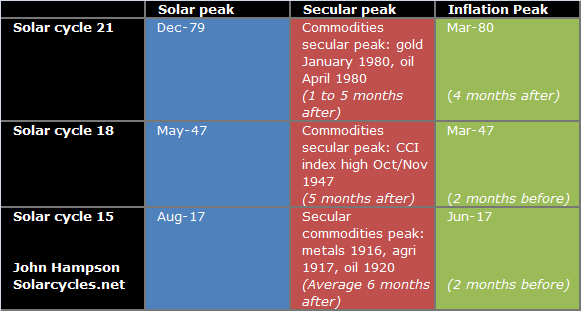
Drawing together the last 3 secular commodities bulls shown, we could anticipate that commodities and inflation should peak in 2013, as the solar maximum is currently forecast between Spring and Fall/Autumn 2013. If the solar peak occurs at the latter or later, there is the potential for the ultimate peak in commodities to stretch into early 2014, but otherwise it could occur in 2013.
Not only have secular commodities bull market peaks fallen close to solar maximums, but secular equities bull market peaks have all done likewise. The reason is that solar activity maximums cause maximum human exciteability (Alexander Chizhevsky) which translates into speculation and risk-taking in the economy and markets. The asset class in a secular bull market is excitably speculated to a peak of excessive valuation.
In support of a peak next year, we see current extreme climate issues and forthcoming food price inflation, commodity and social conflict feedback looping, global central bank inflationary stimulus and currency devaluation all converging. This is all covered in Forecast 2013 Part 1: Inflation.
The biggest threat to a commodities peak next year is weakness in global economic leading indicators, particularly in China. China is the biggest consumer of commodities with its breakneck economic expansion over the last 2 decades. History reveals that economies that developed at such a pace historically invariably derailed at some point. The inbalances in China in its real estate market and export/domestic economies as well as the demographic challenges (chart below) put the country at such risk. A de-railing of China would provide a suitable backdrop for a secular commodities bear market over the next decade, were it to occur.
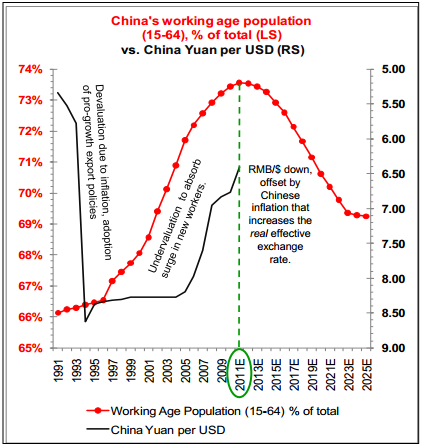
Source: Barry Bannister
The question is whether China and the global economy can reflate sufficiently into 2013 to enable commodities to make their secular finale, before any more serious Chinese slowdown comes to pass (if it does). I expect the last six months of global interest rate cuts, together with renewed US and Japanese QE, to provide that reflation, and perhaps most importantly, the new programme of infrastructure projects in China, that not only should support their economy, but also plays into a secular commodities finale, drawing on both energy and natural resources in its fulfillment. There is some tentative evidence in global leading indicators that the reflation is coming.
The last chart is my projection for how the price action will unfold into 2013. I have drawn together price action for stocks and commodities into the last secular commodities bull market peak, from the shadow inflation peak of 2008 (boxed) and used estimated solar maximum timing. Commodities should start to outperform equities but with both performing bullishly in a pro-risk environment into the end of 2012. Then as commodities start to go parabolic, stocks should top out their cyclical bull and disconnect. The commodities price peak should be around or following the official solar maximum, which is currently predicted between Spring and Fall/Autumn 2013.
Using the 1940s as our guide, with its similar environment of secular commodities bull, negligible interest rates and high government debt, a mild recession should follow in 2014, partially brought on by the excessive price rises in commodities preceding it. The 1948-9 US recession was only a shallow economic downturn lasting less than a year, as ultra low rates supported the economy. The combination of an economic recession together with a preceding price blow-off to extreme valuation, should ensure commodities tumble.
In conclusion, by asset ratios we are into the mature end of the valuation spectrum for the commodities secular bull, and by both secular and solar history, we are into the mature end of the timeline for the secular commodities bull. History suggests we should see a parabolic finale, and we might therefore expect that to come soon, and indeed be final. Commodities should outperform equities from here and at some point equities should diverge and top out, before commodities make their real blow-off top. Thereafter, we might expect a combination of extreme valuation and a tipping into recession to bring about sharp falls, and then a combination of increased supply, a trend reversal in interest rates, and a potential de-railing of China to provide the backdrop to a new secular commodities bear.
Coming Next: Forecast 2013 Part 3: Equities Wind Out Of Secular Bear
John Hampson, UK / Self-taught global macro trader since 2004
www.solarcycles.net (formerly Amalgamator.co.uk) / Predicting The Financial Markets With The Sun
© 2012 Copyright John Hampson - All Rights Reserved Disclaimer: The above is a matter of opinion provided for general information purposes only and is not intended as investment advice. Information and analysis above are derived from sources and utilising methods believed to be reliable, but we cannot accept responsibility for any losses you may incur as a result of this analysis. Individuals should consult with their personal financial advisors.
© 2005-2022 http://www.MarketOracle.co.uk - The Market Oracle is a FREE Daily Financial Markets Analysis & Forecasting online publication.