


The Bear Case For the S&P 500 Stock Market Index
Stock-Markets / Stocks Bear Market Sep 02, 2012 - 05:16 PM GMTBy: Richard_Shaw

 Today’s comments by Fed Chairman Bernanke gave equity markets a boost, but it also caused US Treasuries and gold to rise more strongly in a run to safety.
There are important voices on both the bull side and the bear side of the US stock market predictions.
- On the bull side, for example: Laszlo Birinyi of Birinyi Associates, and Byron Wien of Blackstone Advisory Partners, each see the S&P 500 at 1500 by 2012 year-end — up about 7%
- On the bear side, for example: Barry Knapp of Barclays sees 1330; David Kostin of Goldman Sachs sees 1250, and Adam Parker of Morgan Stanley sees 1167 — down about 5%, 7% and 17% respectively.
Let’s talk about the bear view a bit.
The bear view is essentially an argument that the US economy cannot escape some level of significant recessionary impact in 2013 — mostly due to lack of faith that Congress will effectively manage the tax and spending issues that relate to the “fiscal cliff” in January.
Goldman said (source: ZeroHedge): “… the market has an asymmetric risk profile and offers more downside risk than upside opportunity. Political realities and last year’s precedent suggest the potential that Congress fails to reach agreement in addressing the ‘fiscal cliff’ is greater than what most investors seem to believe …“
Barclays, rather than focusing on the fiscal cliff specifically, is talking about currently declining revenue growth, declining forward earnings forecasts, and the unreasonableness of a 13% earnings increase 2013 over 2012 at this stage in the economy. They think the stock market has gotten ahead of itself and is likely to pull back to the 1330 area.
Barclays also points out that if the election prospects appear to be going strongly toward a Republican controlled Senate and a Republican president, the stock market could celebrate that with a rise from here. They also point out that control of Congress is probably more important than control of the White House if only one is in the cards.
What If There Is A Significant Drop In Earnings?
We looked at the last three important earnings declines to see how the stock market reacted in terms of price change and valuation multiple change.
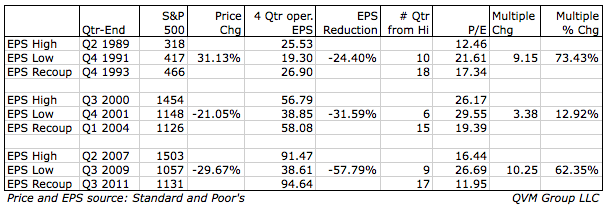
1989-1991-1993
From an operating earnings high for Q2 1999, earnings declined 24.4% over 10 quarters by Q4 1991, then eventually equaled or exceeded the earlier high by Q4 1993, 18 quarters later. In that case, the S&P actually rose in price as the earnings fell, going from a 12.5 P/E multiple at the earnings high to a 21.6 multiple by the earnings low, and then down to a 17.3 multiple when the earnings recouped their former high.
Multiple expansion and market price increase occurred. We would doubt that would happen if a new earnings dip were to evolve in 2013.
2000-2001-2004
From an operating earnings high for Q3 2000, earnings declined 31.6% over 6 quarters by Q4 2001, then eventually equaled or exceeded the earlier high by Q1 2004, 15 quarters later. The S&P declined 21% (less than earnings declined) as the valuation multiple expanded from 26.2 to 29.6; and then down to 19.4 when earnings attained their prior high.
2007-1009-2011
From an operating earnings high for Q2 2007, earnings declined 57.8% over 9 quarters by Q3 2009, then eventually equaled or exceeded the earlier high by Q3 2011, 17 quarters later. The S&P declined 29.7% (much less than earnings declined) as the valuation multiple expanded from 16.4 to 26.7; and then down to 12.0 when earnings attained their prior high.
2013
If an earnings recession occurred in 2013, it seems reasonable, based on recent history, that a 20% to 30% or greater decline could occur.
If the 2012 earnings end up at about $102, then 2013 earnings of $70 or $80 seem quite possible in a moderate fiscal cliff bump in the road — more is possible, of course, but 20% to 30% seems reasonable. Those earnings would compare to a current mean forecast in excess of $110.
If the valuation multiple did not expand (as it did in the last three earnings recessions, and as we understand it typically does), then 12 times $70 to $80 could put the S&P 500 at 840 to 960.
However, if the valuation multiple were to expand by 3 (the lowest of the expansions during the last three earnings recessions), the 15 times $70 to $80 would put the S&P 500 at 1050 to 1200.
That leads us to believe that in the absence of some thing as nasty as the 2008-2009 earnings crash, the 1250 to 1167 predictions by Goldman and Morgan Stanley seem reasonable as most likely worst case scenarios (not maximum worst case, but most likely worst case).
The 1500 scenario by Birinyi and Wien, we presume, assumes that the Congress works something out as a muddle through, and that Europe does not collapse, but also muddles through.
S&P 500 ETFs: SPY, IVV, VOO
Disclaimer and Disclosure:
By Richard Shaw
http://www.qvmgroup.com
Richard Shaw leads the QVM team as President of QVM Group. Richard has extensive investment industry experience including serving on the board of directors of two large investment management companies, including Aberdeen Asset Management (listed London Stock Exchange) and as a charter investor and director of Lending Tree ( download short professional profile ). He provides portfolio design and management services to individual and corporate clients. He also edits the QVM investment blog. His writings are generally republished by SeekingAlpha and Reuters and are linked to sites such as Kiplinger and Yahoo Finance and other sites. He is a 1970 graduate of Dartmouth College.
Copyright 2006-2011 by QVM Group LLC All rights reserved.
Disclaimer: The above is a matter of opinion and is not intended as investment advice. Information and analysis above are derived from sources and utilizing methods believed reliable, but we cannot accept responsibility for any trading losses you may incur as a result of this analysis. Do your own due diligence.
Richard Shaw Archive |
© 2005-2022 http://www.MarketOracle.co.uk - The Market Oracle is a FREE Daily Financial Markets Analysis & Forecasting online publication.