


Could Price Bar Charts Help You Forecast the Markets?
InvestorEducation / Technical Analysis Aug 17, 2012 - 05:49 AM GMTBy: EWI

 Senior Analyst Jeffrey Kennedy has spent over 15 years developing techniques to "read between the lines" on a price chart, and he shares some of his techniques with you in a FREE eBook: Learn to Identify High Confidence Trading Opportunities Using Price Bars and Chart Patterns.
You'd be amazed at how a simple price bar can provide you with so much information that can improve your trading success. In this excerpt from his eBook, Jeffrey explains how to interpret price bars and what that means for the subsequent market moves. Learn how you can download the entire 14-page eBook below.
Here's a picture of two different price bars that we will consider to be daily price bars. What story does the single price bar on the left tell you?
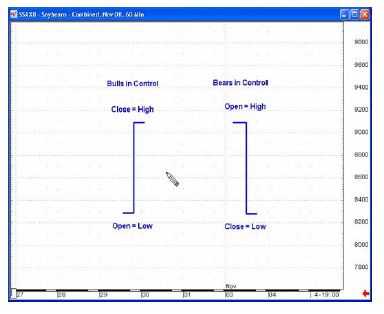
Prices opened that day at the lowest price and closed at the highest price, which means that the buyers, or bulls, are in total control of the market. The bears have no power whatsoever, and, because the market closed so high, odds are that the price will continue up the next day. As I said, one price bar can give you tons of information about a financial market.
Now, look at the price bar on the right. It tells you a similar story in the opposite direction. Once the market opened, it got slammed to the down side. It stayed down hard all day and closed on the lows. A market like this is dominated by the bears, the sellers, and odds favor further decline the following day. It means that the bulls, or the buyers, have no control in this market.
Although these kinds of price bars are fairly rare, they may open your eyes to how much information a single price bar can contain, especially if you know how to interpret it.
These two price bars are more like what you will encounter every day.
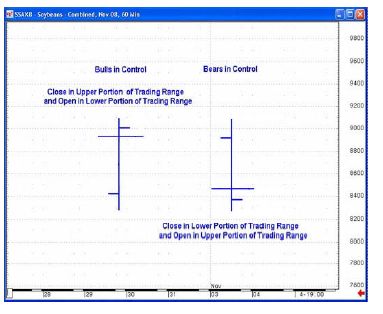
The price bar on the left side shows that the bears, or the sellers, opened the market up and pushed it down a little bit. In a sense, they had some control, but not much. Then the buyers, or the bulls, took control of this market so that it closed above the open. This type of price bar shows up in an uptrending market.
Conversely, the price bar on the right often shows up in downtrending markets. It signifies that the bears control the market. You could say that the buyers gave it a feeble attempt early on, but by the close, the sellers had taken over. Closes don't lie, and they are the most important item on the price chart.
|
Learn to Identify High Confidence Trading Opportunities Using Price Bars and Chart PatternsWhen you look at a price chart, can you quickly spot the dominant trend? What about important reversals, or possible support/resistance levels? EWI has just released a free 14-page eBook: Learn to Identify High Confidence Trading Opportunities Using Price Bars and Chart Patterns. Senior Analyst Jeffrey Kennedy has spent over 15 years developing techniques to "read between the lines" on a price chart, and he shares some of his techniques with you in this new resource. You'll be amazed at how a simple price chart can provide you so much information that can improve your trading success. |
This article was syndicated by Elliott Wave International and was originally published under the headline Single- and Multi-Bar Price Analysis: Could It Help You Forecast the Markets?. EWI is the world's largest market forecasting firm. Its staff of full-time analysts led by Chartered Market Technician Robert Prechter provides 24-hour-a-day market analysis to institutional and private investors around the world
About the Publisher, Elliott Wave International
Founded in 1979 by Robert R. Prechter Jr., Elliott Wave International (EWI) is the world's largest market forecasting firm. Its staff of full-time analysts provides 24-hour-a-day market analysis to institutional and private investors around the world.
© 2005-2022 http://www.MarketOracle.co.uk - The Market Oracle is a FREE Daily Financial Markets Analysis & Forecasting online publication.