


Weak Second Quarter For Linn Energy Not A Cause For Concern
Commodities / Natural Gas Aug 16, 2012 - 03:35 AM GMTBy: Elliot_H_Gue

 Linn Energy LLC’s (NSDQ: LINE) second-quarter results fell short of expectations, prompting management to reduce its full-year forecast for distributable cash flow (DCF). The limited liability company (LLC) generated $0.70 per unit in DCF, which fell slightly short of the declared quarterly payout of $0.725 per unit. In contrast, Linn Energy covered its payout by 114 percent in the first quarter.
Despite these disappointing results, the firm grew its hydrocarbon output by 76 percent from a year ago, to 630 million cubic feet equivalent per day. Much of this upside stemmed from the integration of new acquisitions, though Linn Energy also posted solid production increases in core operating regions such as the Permian Basin and the Granite Wash.
Linn Energy’s efforts to improve drilling efficiency and the implementation of an innovative system for handling the water used in hydraulic fracturing, a production technique that unlocks hydrocarbons from low-permeability reservoir rocks, also reduced expenses from year-ago levels.
What drove the LLC’s disappointing second quarter? The price of natural gas liquids (NGL)–a group of heavier hydrocarbons whose price historically has tracked movements in the value of West Texas Intermediate crude oil–tumbled precipitously.
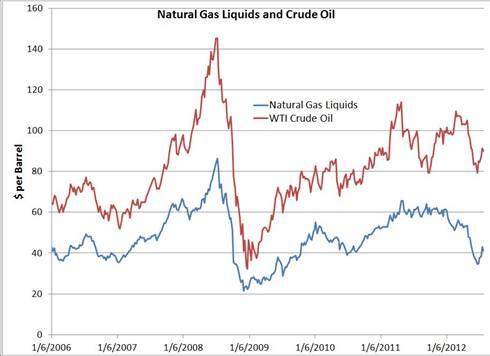
Source: Bloomberg
The barrel of mixed NGLs tracked in this graph consists of 36.5 percent ethane, 31.8 percent propane, 11.2 percent normal butane, 6.2 percent iso-butane and 14.3 percent natural gasoline, all of which are delivered at the hub in Mont Belvieu, Texas. As you can see, NGL and oil prices surged in 2007 and early 2008, collapsed in 2008 and early 2009, and rose in tandem from mid-2009 through to 2011.
From the beginning of 2006 to mid-2011, a barrel of NGLs usually fetched roughly 60 percent of the price of a barrel of WTI crude oil. But this long-standing price relationship has deteriorated over the past eight months; a mixed barrel of NGLs recently bottomed at about 40 percent of the benchmark oil price for North America.
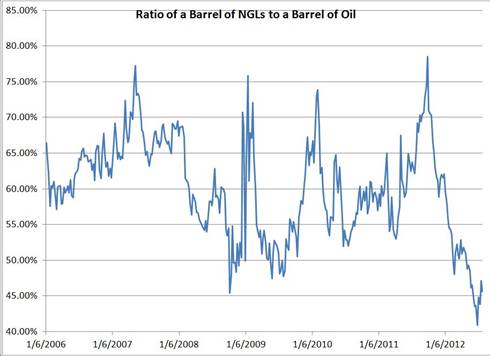
Source: Bloomberg
When you compare the price of a mixed barrel of NGLs to the market value of Brent crude oil, the differential is even greater, as this international oil benchmark has commanded a significant premium to WTI crude oil over the past two years.
Ultra-depressed US natural gas prices, the decline in NGL prices and the discounted price of WTI crude oil relative to international reference points stem, in part, from rising production of all three commodities from the nation’s prolific shale oil and gas plays.
But there’s an old saw in the energy business that says it’s harder to grow oil and liquids output than natural-gas production. The shale oil and gas revolution hasn’t invalidated this maxim. Although US oil output has increased for the first time in more than 30 years, this uptick in pales in comparison to the surge in natural-gas production that has overwhelmed domestic demand.
The supply-demand balance in the NGL market lies between the extremes of the glut of natural gas in the domestic market and the substantial supply shortfall that forces the US to make up the difference by importing significant quantities of oil.
Domestic NGL production eclipsed 2 million barrels per day in 2010–a record high–and averaged 2.38 million barrels per day in May 2012, a 7 percent increase from year-ago levels.
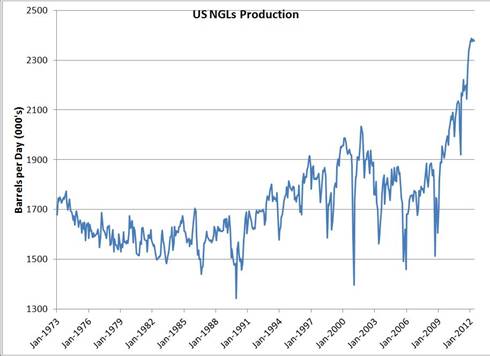
Source: Energy Information Administration
At the same time, the newfound abundance of ethane and propane has revivified the domestic petrochemical industry, giving chemical manufacturers a dramatic cost advantage over producers in Asia and the Middle East that rely on naphtha and other oil derivatives for feedstock.
Over the past decade, multinational chemical producers such as Dow Chemical (NYSE: DOW) have gradually shifted their production base from the US to Asia (to build a presence in growing demand centers) and the Middle East (to take advantage of lower feedstock costs).
Last year, this trend reversed course. A number of major petrochemical producers announced plans to restart shuttered crackers or construct world-class plants to take advantage of favorable pricing on ethane and propane.
For example, Dow Chemical–the world’s second-largest chemical outfit–announced plans to restart its ethane cracker at its St. Charles complex, upgrade one plant in Louisiana and another in Texas to enable them to accept ethane feedstock and build a new ethylene production plant on the Gulf Coast in 2017. The firm aims to improve its ethane cracking capabilities by 20 percent to 30 percent to take advantage of the superior economics offered by the NGL.
And Royal Dutch Shell (LSE: RDSA, NYSE: RDS: A) in June 2011 announced that it would build a world-scale ethylene plant in Appalachia that would source its feedstock from the Marcellus Shale. Meanwhile, Chevron Phillips Chemical–a joint venture between Chevron Corp (NYSE: CVX) and ConocoPhillips (NYSE: COP)–plans to build a major ethane cracker and ethylene derivatives facility in the Texas Gulf Coast region.
Equally important, the US has some capacity to export propane and NGL-derived products. Both Enterprise Products Partners LP (NYSE: EPD) and Targa Resources Partners LP (NYSE: NGLS) own or are in the process of building propane export capacity. However, the nation’s existing export capacity is maxed out.
The recent price decline has hit lighter NGLs, especially ethane, which recently slipped to a low of roughly $12 per barrel from more than $30 per barrel at the end of 2011. Although the prices of propane and butane have also tumbled considerably from their 2012 highs, producers can still generate a solid return on these NGLs.
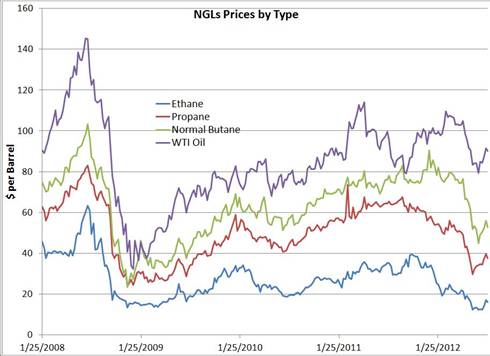
Source: Bloomberg
The most conservatively run of the upstream MLPs, Linn Energy hedges all its expected oil and gas production for years in the future, limiting its exposure to the vagaries of the commodities market. However, this extensive hedge book, which insulated the firm from the collapse in commodity prices in late 2008 and early 2009, isn’t as effective protecting the firm’s cash flow against fluctuations in NGL prices.
Producers traditionally have hedged NGL production with oil futures, reflecting the long-standing relationship between the prices of these two commodities. Unfortunately, NGL prices have declined to a much greater extent than the price of WTI crude oil; in this environment, a short position in crude oil failed to fully protect producers from plummeting NGL prices.
Although producers can hedge NGL prices, the market for these futures lacks sufficient liquidity. Clay Jeansomme, Linn Energy’s vice president of investor relations, addressed this challenge during a conference call to discuss the LLC’s second-quarter results:
[I]f you look back and say, okay, when we looked at hedging it [Linn Energy’s NGLs exposure] it’s backwardated by 30, 40 percent, how bearish do you want to be? But having said that, you would have endured that king of lowered pricing for six months and so you saw the lower pricing that we are seeing today. So, probably nets up to about the same. It just didn’t look that compelling honestly, and even looking back it’s still questionable as to whether it’s compelling.
So, until there is a longer-dated, less-backwardated NGL hedge market–and we look at it, trust me, we will look at it every day, because if we had the ability to hedge NGL for 100 percent and then they would be consistent with everything else we do at LINN–we would be all over that. But the economics has just never looked compelling at the times we’ve looked at it. So we’ll keep looking but I don’t regret it really at this point.
When a producer hedges its output, the firm sells that commodity forward. That is, if an upstream operator expects to flow 1,000 barrels of oil per day in May 2013, the firm’s traders would sell May 2013 futures contracts for 31,000 barrels of oil (31 days in May times 1,000 barrels of oil per day). At present, the contract for WTI crude oil to be delivered in May 2013 sells for about $90 per barrel, while the current quote in the spot market is about $88 per barrel. In this case, the hedge locks in a guaranteed price on this future production that exceeds prevailing prices.
The differentials between the current price of natural gas and futures contracts are even more favorable: Whereas the fuel fetches $3.25 per million British thermal units (mmBtu) in the spot market, natural gas to be delivered in July 2013 goes for $3.65 per mmBtu. Producers can lock in natural gas prices of more than $4 per mmBtu on futures contracts for December 2013. In this situation, the market is in a state of contango–that is, futures contracts trade at a premium to spot prices and near-term futures contracts.
The NGL market, in contrast, finds itself in steep backwardation, where future prices are significantly lower than prevailing spot prices. In other words, a producer seeking to hedge its NGL prices would lock in a price on future production that’s 30 percent to 40 percent lower than the current quote.
The lack of an efficient means of hedging NGL output, coupled with a sharp drop in the prices of these commodities, explains why Linn Energy’s DCF failed to cover its quarterly distribution. Excluding the effect of weak NGL prices, the LLC would have generated enough cash flow to cover 115 percent of its quarterly payout.
Even if NGL prices remain at depressed levels, management expects the publicly traded partnership’s distribution coverage to improve to 120 percent in 2013. This forecast could ultimately prove conservative; butane prices have climbed about 18 percent since their June nadir, propane prices have recovered by more than 30 percent and ethane prices have rebounded by almost 40 percent.
Management’s bullish outlook reflects three upside drivers: the integration of new acquisitions, a focus on growing oil production organically and a shift in NGL volumes from Conway, Kan., to Mont Belvieu, Texas.
For more on Linn Energy and two other picks, check out my free report, The Top Growth Stocks To Own Now.
Mr. Gue is also editor of The Energy Strategist, helping subscribers profit from oil and gas as well as leading-edge technologies like LNG, CNG, natural gas liquids and uranium stocks.
He has worked and lived in Europe for five years, where he completed a Master’s degree in Finance from the University of London, the highest-rated program in that field in the U.K. He also received his Bachelor’s of Science in Economics and Management degree from the University of London, graduating among the top 3 percent of his class. Mr. Gue was the first American student to ever complete a full degree at that business school.
© 2012 Copyright Elliott H. Gue - All Rights Reserved
Disclaimer: The above is a matter of opinion provided for general information purposes only and is not intended as investment advice. Information and analysis above are derived from sources and utilising methods believed to be reliable, but we cannot accept responsibility for any losses you may incur as a result of this analysis. Individuals should consult with their personal financial advisors.
Elliott H. Gue Archive |
© 2005-2022 http://www.MarketOracle.co.uk - The Market Oracle is a FREE Daily Financial Markets Analysis & Forecasting online publication.